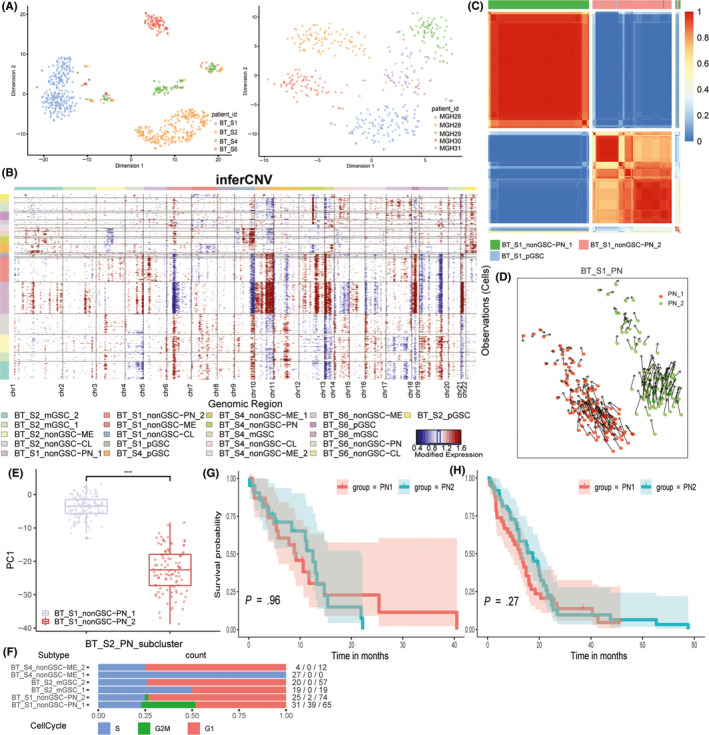
FIGURE 2.

A, the tsne plot of neoplastic cells annotated by patient ID. B, inferred CNV based on neoplastic cells scRNA‐seq divided by patient ID and subtypes. Red means amplification and blue indicates deletion. C, consensus cluster within patient BT_S1 PN subtype of cells, subclones were clustered together. D, transition direction predicted by RNA velocity in patient BT_S1 PN subclones. E, PC1 values’ distribution of patient BT_S1 PN subtype of cells. F, proportion of cells in different cell cycle stages of neoplastic cells in each patient G, Kaplan‐Meier curve of primary IDH wild‐type glioblastoma in TCGA database (Hiseq). H, Kaplan‐Meier curve of primary IDH wild‐type glioblastoma in TCGA database (microarray)
