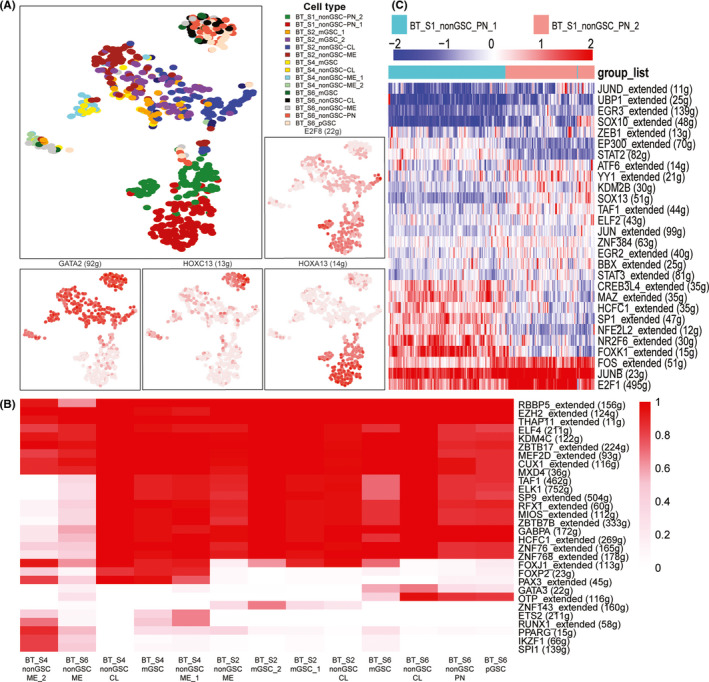
FIGURE 3.

A, neoplastic cells of all patients clustered by regulon activity. The red of the surrounding plots represents the activity of regulons (AUC). B, heat map of binarized regulon network activity, red means regulon on and blank means regulon off. C, patient BT_S1 PN subclone cells hierarchy clustered by regulon activity (AUC). The heat map list only the regulons with significant differences
