
FIGURE 4.
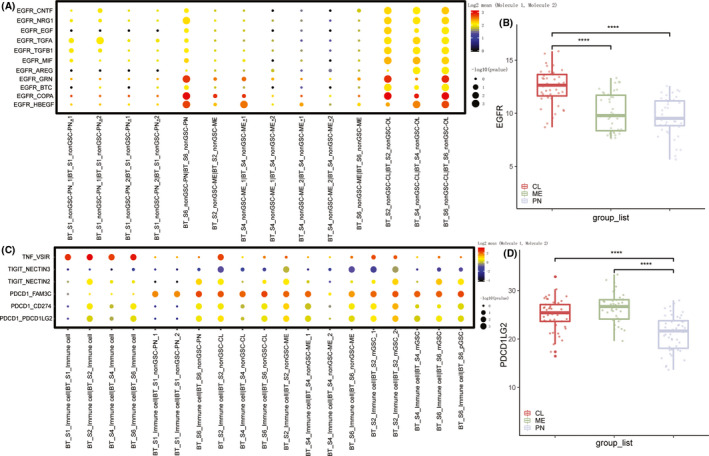
A, the receptor‐ligand interaction (EGFR) within each subtype of each patient. B, EGFR expression of each subtype primary IDH wild‐type glioblastoma from TCGA database. C, the receptor‐ligand interactions between immune cells of each patient and neoplastic subtype of cells. D, the expression of PDCD1LG2 of each subtype primary IDH wild‐type glioblastoma from TCGA database