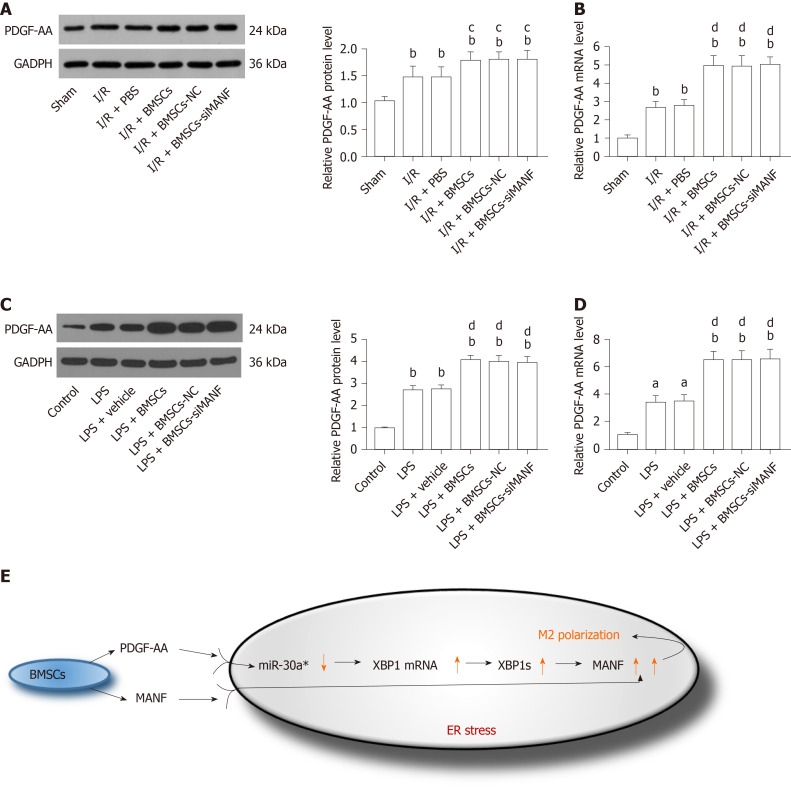
Figure 10.
In vivo and in vitro analysis of platelet-derived growth factor-AA expression. A and B: Western blot (A) and qRT-PCR analysis (B) of PDGF-AA expression in the injured brains. bP < 0.01 vs Sham group; cP < 0.05, dP < 0.01 vs I/R and I/R + PBS groups; C and D: Western blot (C) and qRT-PCR analysis (D) of PDGF-AA in LPS-stimulated microglia in the presence or absence of BMSCs. aP < 0.05, bP < 0.01 vs Control group; dP < 0.01 vs LPS and LPS + vehicle groups. The values are expressed as the mean ± SD (n = 6); E: Proposed mechanism for synergistic regulation of PDGF-AA/miR-30a*/XBP1/MANF pathway and MANF paracrine signaling during BMSCs-induced M2 polarization. PDGF-AA: Platelet-derived growth factor-AA; GAPDH: Glyceraldehyde-3-phosphate dehydrogenase; I/R: Ischemia/reperfusion; LPS: Lipopolysaccharide; PBS: Phosphate-buffered saline; BMSCs: Bone marrow mesenchymal stem cells; BMSCs-NC: Negative control-transfected BMSCs; BMSCs-siMANF: MANF siRNA-transfected BMSCs; XBP1: X-box binding protein 1; MANF: Mesencephalic astrocyte–derived neurotrophic factor; ER: Endoplasmic reticulum.

