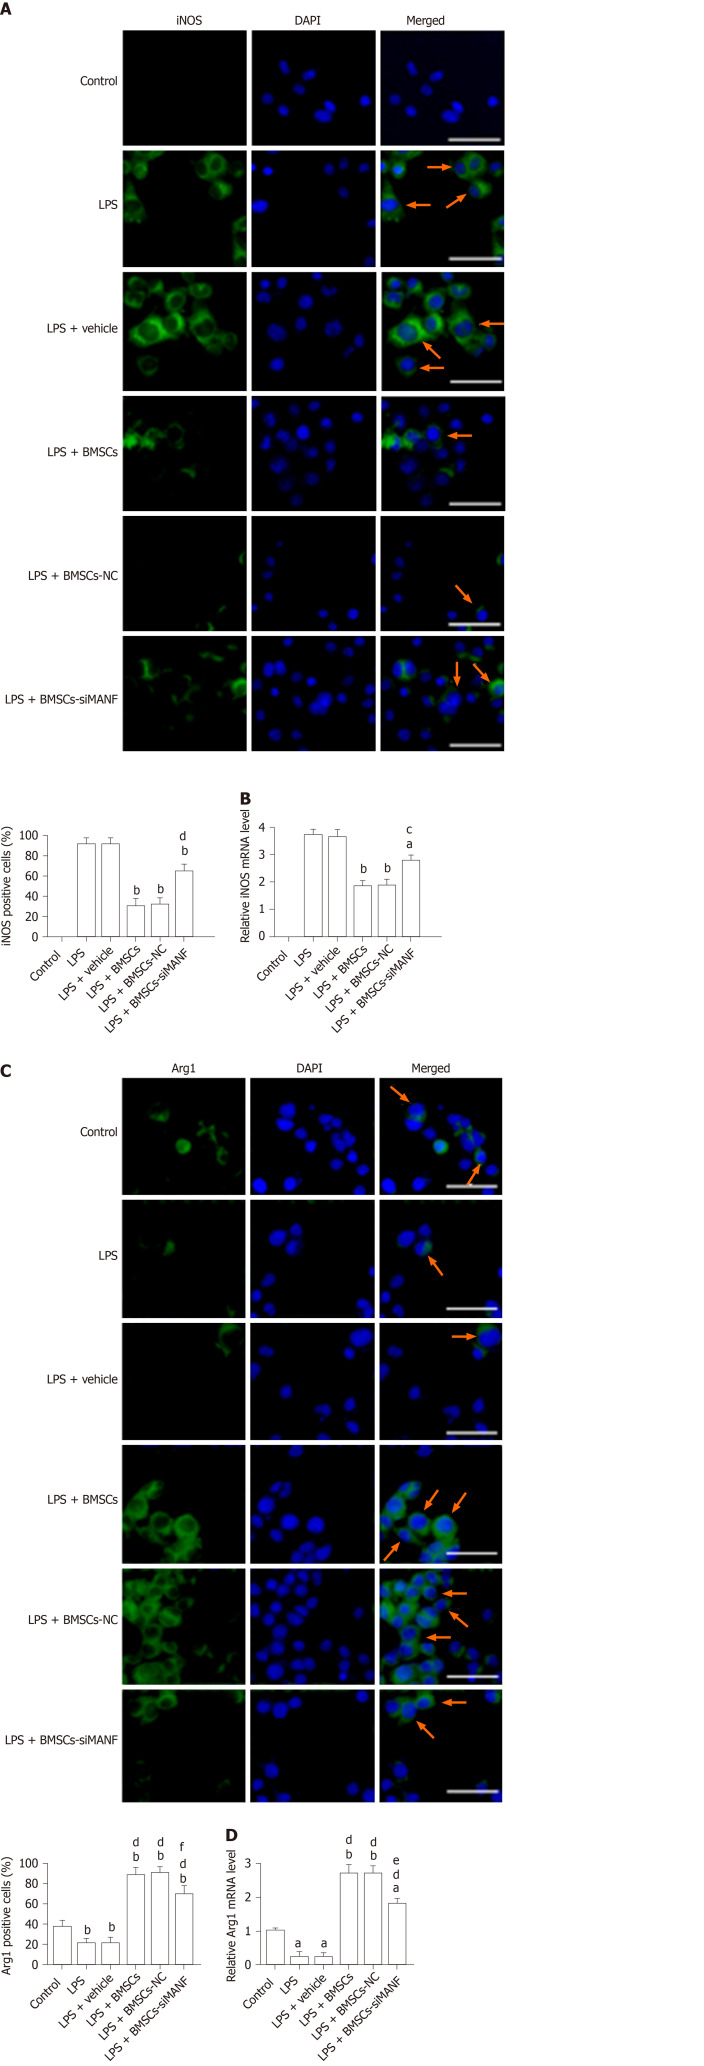
Figure 7.
In vitro analysis of M1 and M2 polarization markers following exposure to lipopolysaccharide and bone marrow mesenchymal stem cells. A and B: Immunocytochemistry (A) and qRT-PCR analysis (B) of iNOS expression in microglia. Representative images of immunofluorescence staining for iNOS (green), with DAPI (blue) as a nuclear counterstain, are shown. aP < 0.05, bP < 0.01 vs LPS and LPS + vehicle groups; cP < 0.05, dP < 0.01 vs LPS + BMSCs and LPS+BMSCs-NC groups. Scale bar = 50 μm. Arrows point to the iNOS+ cells; C and D: Immunocytochemistry (C) and qRT-PCR analysis (D) of Arg1 expression in LPS-stimulated microglia in the presence or absence of BMSCs. Representative images of immunofluorescence staining for Arg1 (green), with DAPI (blue) as a nuclear counterstain, are shown. aP < 0.05, bP < 0.01, vs Control group; dP < 0.001 vs LPS and LPS + vehicle groups; eP < 0.05, fP < 0.01 vs LPS + BMSCs and LPS+BMSCs-NC groups. Scale bar = 50 μm. Arrows point to the Arg1+ cells. The values are expressed as the mean ± SD (n = 6). LPS: Lipopolysaccharide; BMSCs: Bone marrow mesenchymal stem cells; BMSCs-NC: Negative control-transfected BMSCs; BMSCs-siMANF: MANF siRNA-transfected BMSCs; iNOS: Inducible nitric oxide synthase; Arg-1: Arginase-1; DAPI: 4'6-diamidino-2-phenylindole.

