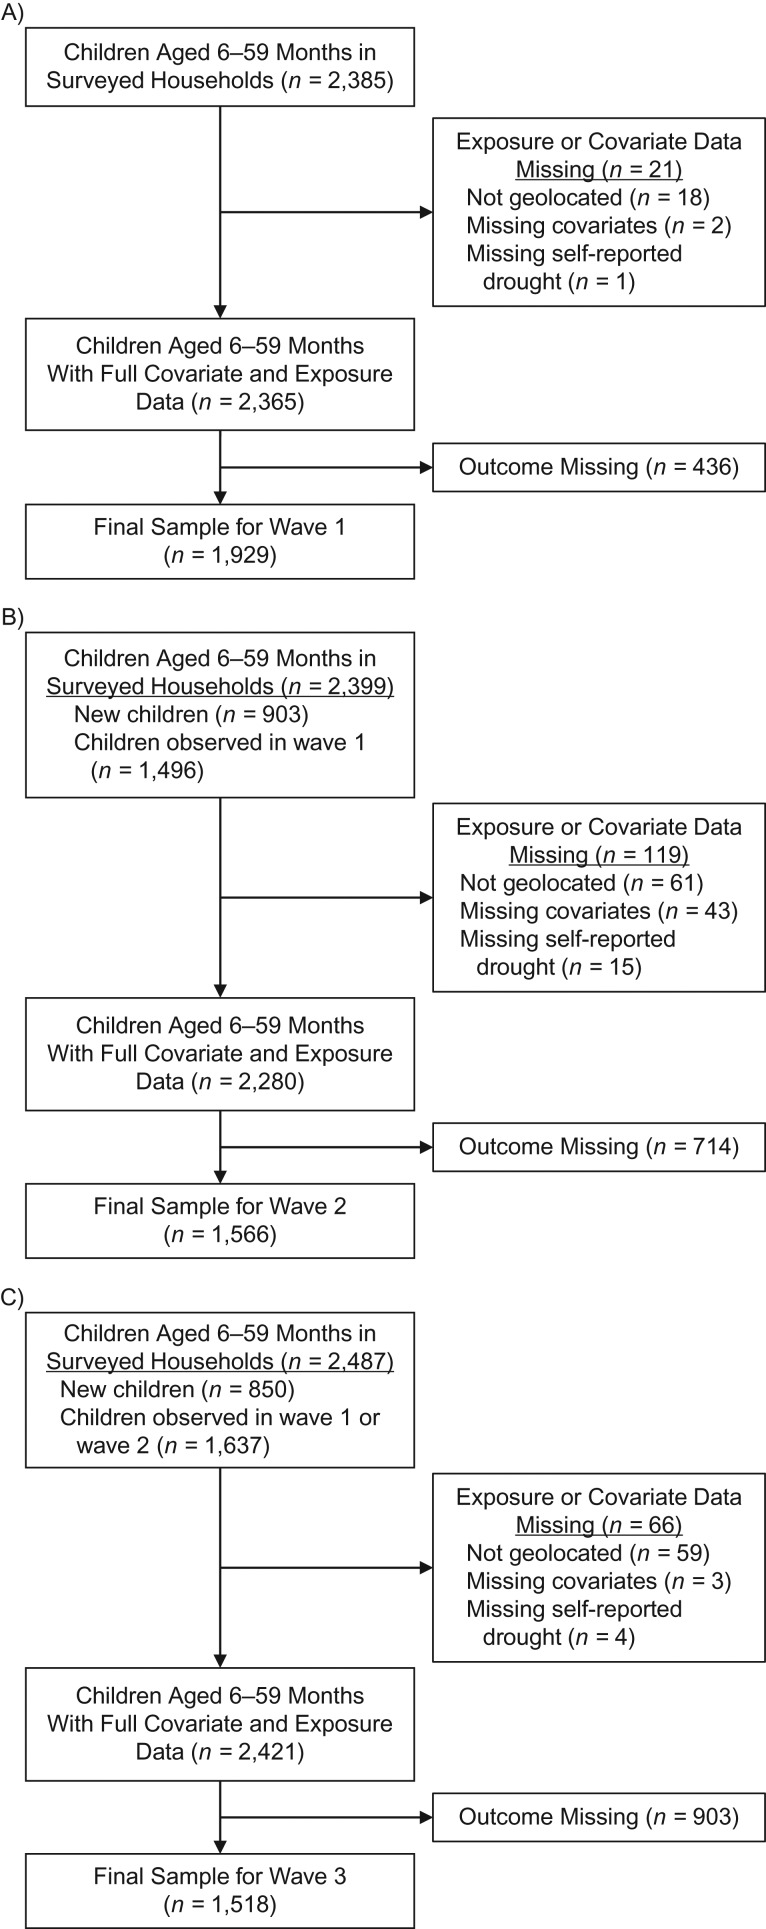
Figure 1.
Flow diagram of study subjects between 6 and 59 months of age included in the Uganda National Panel Survey, Uganda, 2009–2012. A) Wave 1, B) wave 2, and C) wave 3 (total n = 5,013 observations of 3,223 unique children aged 6–59 months; mean number of observations per child = 1.6). The primary reason cited for missing outcome at each wave was that the child was not present at the time of survey (28.0%, 50.0%, and 63.9% at waves 1, 2, and 3 respectively).

