Figure 6.

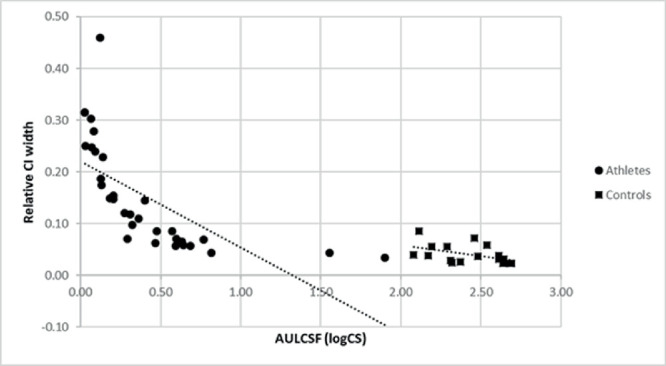
Scatterplot for the 68.2% HWCI of the CSF measured by the qCSF procedure in athletes (circle) and controls (square). The relative CI widths plotted were obtained by dividing the CI width by the AULCSF.

Scatterplot for the 68.2% HWCI of the CSF measured by the qCSF procedure in athletes (circle) and controls (square). The relative CI widths plotted were obtained by dividing the CI width by the AULCSF.