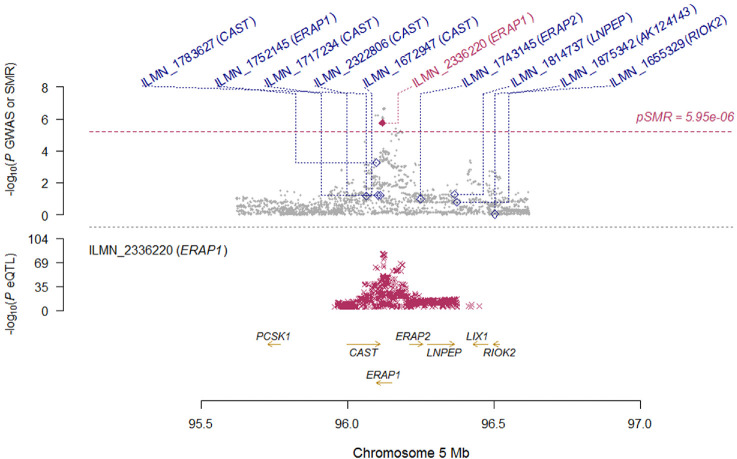
Figure 3.
Locus zoom plot of SMR analysis for ERAP1 locus. Top plot, grey dots represent the P values for SNPs from the comparison between AS+AAU+ and AS+AAU-, diamonds represent the P values for probes from the SMR test. Bottom plot, the eQTL P values of SNPs from the CAGE study for the ILMN_2336220 probe tagging ERAP1.

