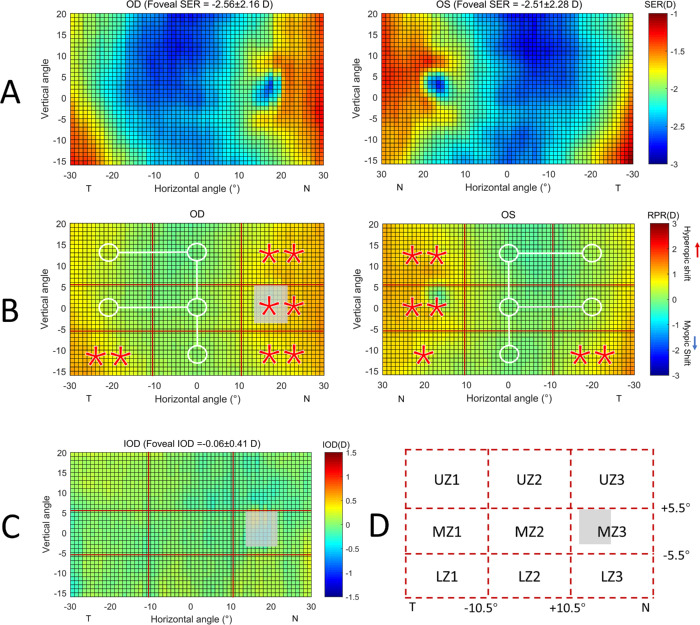
Figure 1.
(A) Averaged 2D maps of SER in the isomyopic group. Values in the x-axis indicate the nasal retina (“N”) and the temporal retina (“T”), respectively. For the y-axis, positive values represent the superior retina and negative values represent the inferior retina. The color-code is in diopters. (B) Statistical analysis of the changes of relative peripheral refraction (RPR) in eight zones with respect to the center. A zone with a white circle represents no statistical difference with the center, whereas a red star represents a statistically significant hyperopic difference (*P < 0.05, **P < 0.01). (C) Averaged 2D map of the interocular differences (IODs) generated by SER-maps of right eyes minus the corresponding points on left eyes. No significant differences among the nine zones were observed (F = 0.535, P = 0.829). (D) Abbreviations were used to represent the different zones: L: low, M: middle, and U: up. The grey area in each map represents the optics disc area, which were not included in the analysis.

