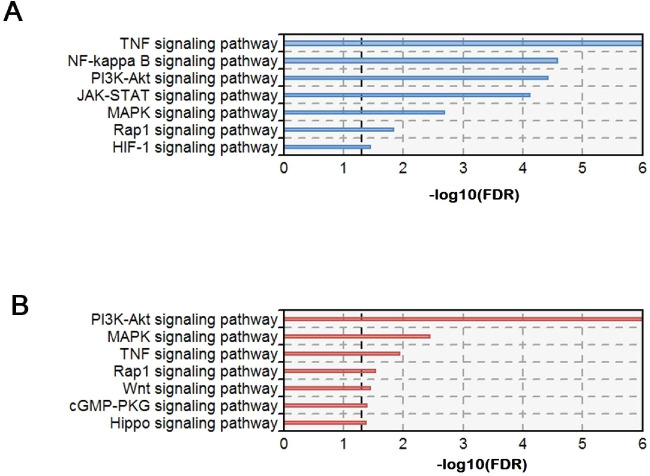
Figure 4.
Signal transduction-related pathways enriched at different time points. (A) Significant signal transduction-related pathways were enriched in the comparison between the PBS-2 and Af-2 groups. (B) Significant signal transduction-related pathways were enriched in the comparison between the Af-5 and Af-2 groups. The x-axis represents –log10 (FDR), and the y-axis represents the name of each pathway.

