Figure 11.
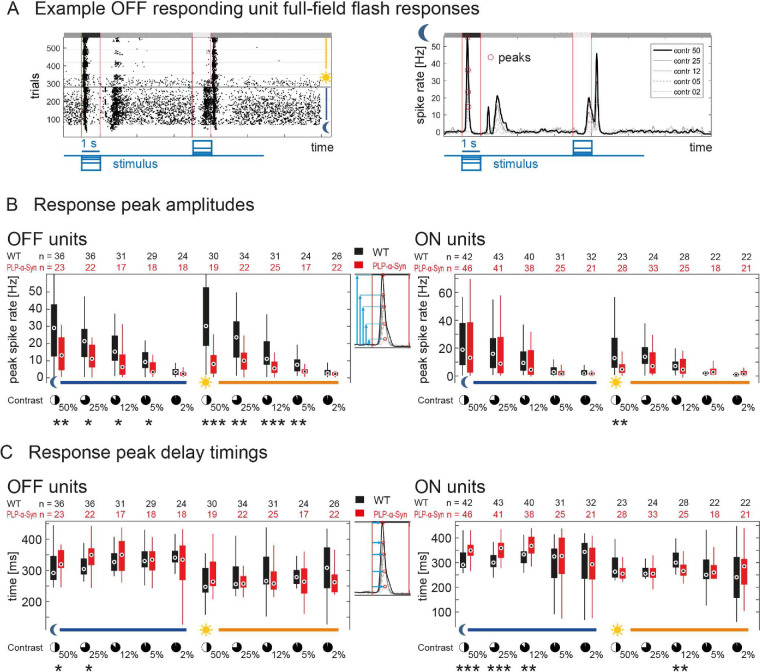
Ganglion cell spiking activity recorded on MEAs. (A) Example spiking responses of a wild-type OFF ganglion cell to the full-field flash stimulus. (Left) Raster plot of all trials; each dot represents a spike, luminance level switch is indicated. (Right) Average convolved spike rates to all flash contrasts in scotopic luminance. (B) Peak amplitudes of preferred polarity flash responses of OFF (left) and ON (right) ganglion cells across all contrasts in both luminance levels. Amplitudes were significantly different for higher contrasts in both luminance levels (OFF cells) and at 50% contrast in photopic luminance (ON cells). (C) Peak delay timings of preferred polarity flash responses of OFF (left) and ON (right) ganglion cells across all contrasts in both luminance levels. Delays were significantly different, mainly in scotopic luminance at higher contrasts for both OFF and ON cells. *P < 0.05, **P < 0.01, ***P < 0.001, Wilcoxon rank-sum test. Circles represent medians, boxes are the 25th to 75th percentiles, and whiskers are the most extreme data points. The numbers differ because individual cell responses could not be measured at all contrasts. The age of animals was 8 to 11 weeks.

