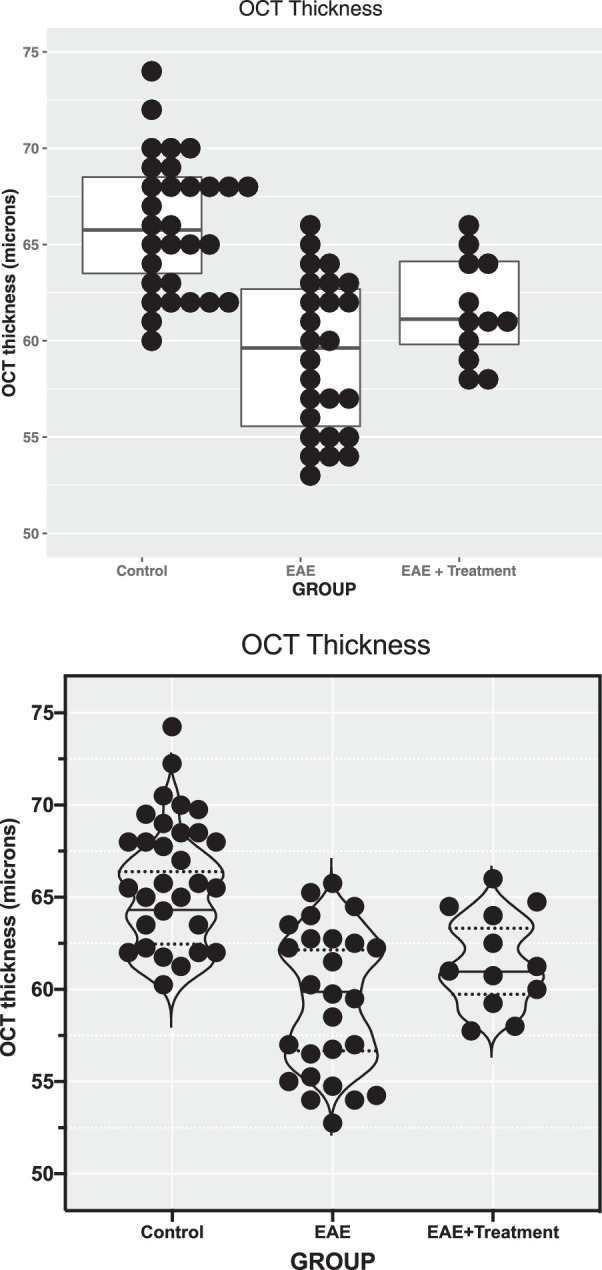
Figure 1.

OCT of the inner retinal layer thickness displayed by categorical groups. The raw data for OCT thickness represent the thickness of the RGC complex in microns. (A) Produced with software program R. Individual data points with the same value are stacked laterally to accurately depict a distribution, and a box plot with median and first and third quartiles is superimposed. Note that in the EAE group there are more points at the upper and lower portions of the distribution than expected for a Gaussian distribution (“heavy” tails). (B) Produced with GraphPad Prism software with the same data as in A. Random noise was added to the scatterplot data (“jittering”) to prevent overplotting observations with the same value. In the “standard” scatterplot from Prism, the width of the distribution of points is proportionate to the number of points at that y value. In this example, a violin plot was superimposed, in contrast to the box plot in A. Violin plots are sometimes used to display the smoothed shape of the frequency distribution of the data. Median values and quartiles are indicated with horizontal lines in both plots.
