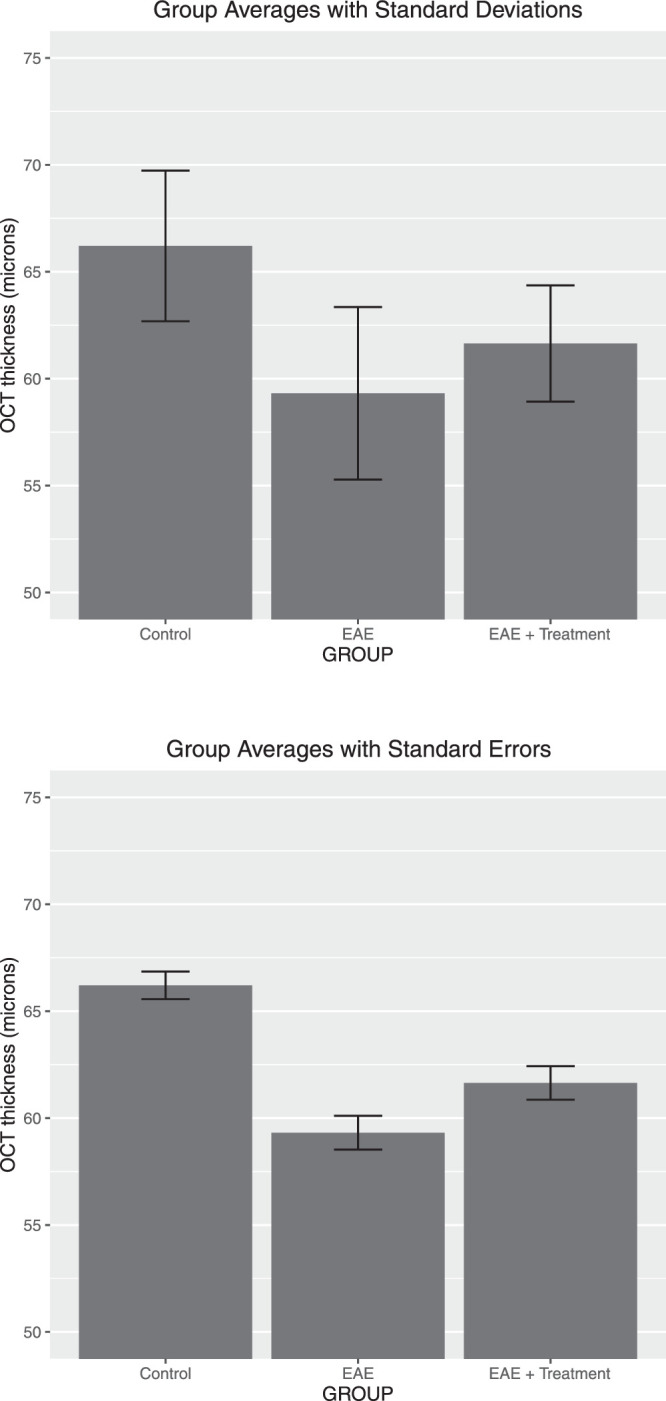
Figure 2.

Suboptimal data presentation: bar chart of OCT thickness of the RGC complex group in microns. Averages with ±1 SD added (top plot) and ±1 SE (bottom plot) are shown for the same data as in Figure 1. The distribution and number of data points are not shown.
