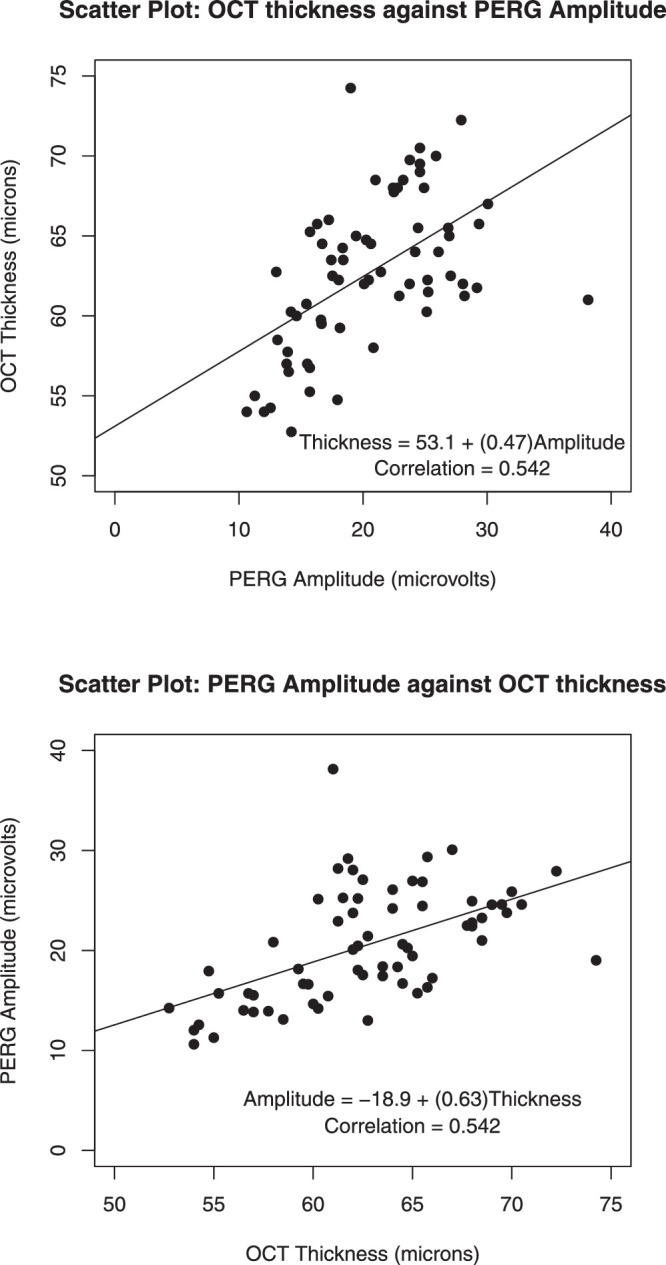
Figure 4.

Scatterplots of OCT thickness and PERG amplitude, with fitted least-squares lines added. Axes are reversed in the second plot. PERG amplitudes are given in microvolts and were calculated from the P1 peak to the N2 trough from the evoked potentials. The OCT thickness of the inner retinal layer is given in microns.
