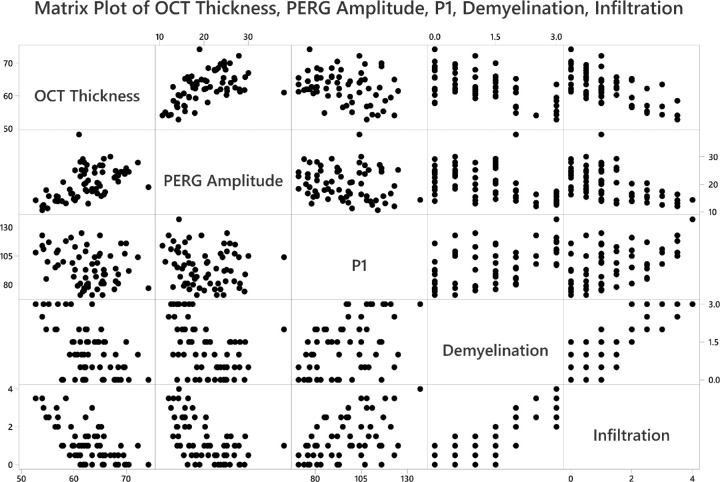
Figure 5.
Pairwise scatterplots to display the relationships among different measurements, such as thickness of the RGC complex (OCT thickness), PERG amplitude, implicit time of the P1 peak, and grade of demyelination and magnitude of cell infiltration in optic nerves. Each row of figures has the labeled box as the y-axis (e.g., first row y-axis is OCT thickness; second row y-axis is PERG amplitude).

