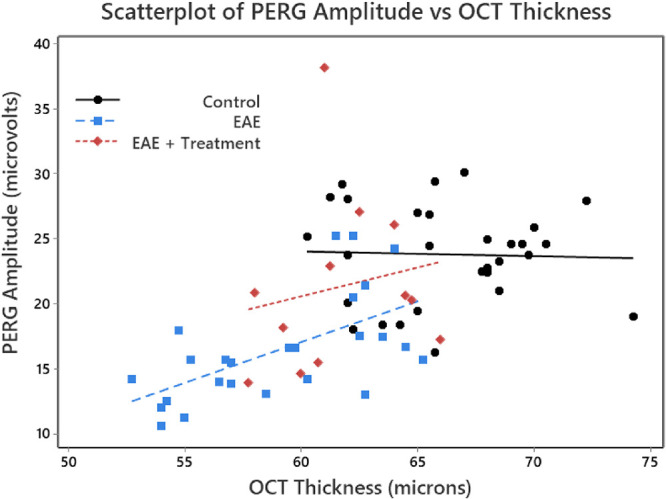
Figure 6.

Scatterplots of OCT thickness against PERG amplitude for each eye, stratified for the three treatment groups. A linear regression was performed for each of the three groups. PERG amplitudes are given in microvolts and were calculated from the P1 peak to the N2 trough from the evoked potentials. The OCT thickness of the inner retinal layer is given in microns. Note that we used a color scheme that would accommodate a reader with red–green color blindness.
