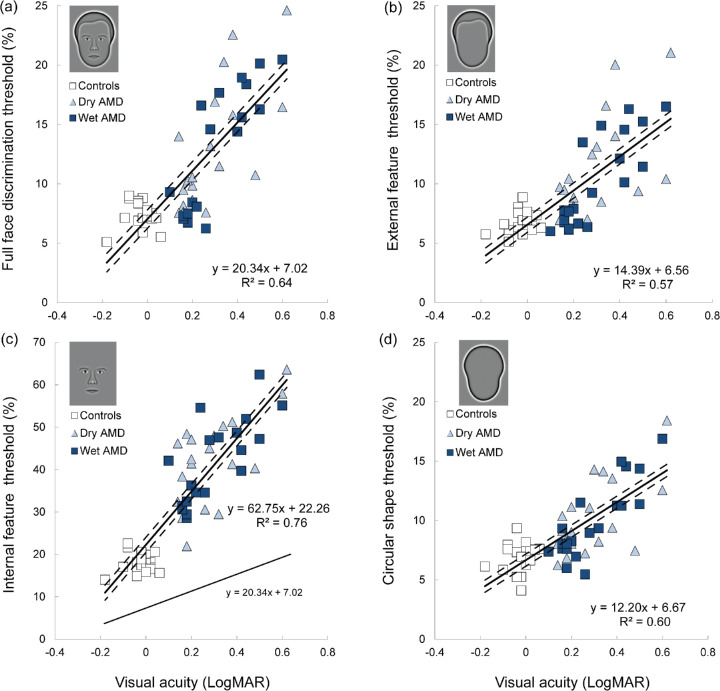
Figure 5.
Discrimination thresholds as a function of distance VA (LogMAR) for (a) full faces (b) external features (c) internal features, and (d) shapes. Solid line indicates the line of best fit; dashed lines represent 95% confidence intervals. The external (b) and internal (c) features were presented in isolation. Thresholds for these features embedded within a fixed face context were not significantly different from those presented in isolation. Note that, because of significant differences in sensitivity across all groups, data for the internal features (c) are presented on a different y-axis scale. To aid visual comparison, the line of best fit for full faces, presented in (a), has been replicated in (c) for internal features (see lower line in [c]).

