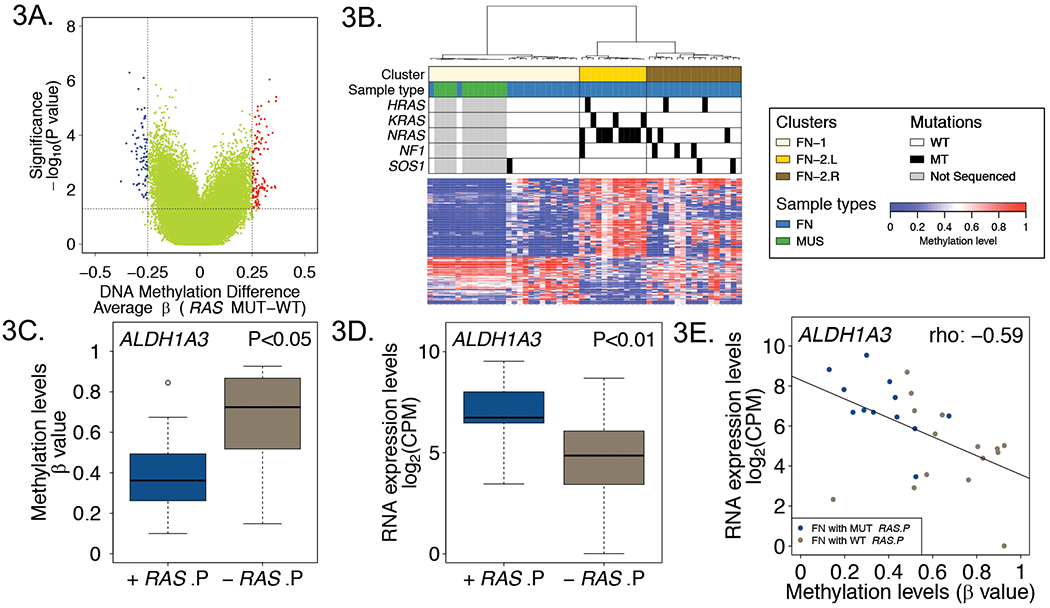
Figure 3. DNA methylation characteristics associated with RAS mutant and wild-type FN RMS tumors.

A, Volcano plot displaying differentially methylated probes between RAS mutant and wild-type FN RMS tumors. Red and blue dots denote hypermethylated and hypomethylated probes in RAS mutant versus wild-type tumors, respectively. B, Heat map comparing DNA methylation of normal fetal and neonatal skeletal muscle with RAS mutant and wild-type FN tumors based on differentially methylated probes between RAS mutant and wild-type FN tumors. Mutation events are represented by black rectangles in the upper panel. Promoter DNA methylation (C) and RNA expression (D) levels of ALDH1A3 in RAS pathway mutant and wild-type FN RMS tumors. E, Correlation plot of DNA methylation versus RNA expression levels for ALDH1A3 in RAS pathway mutant and wild-type FN RMS tumors. Abbreviations: WT, wild-type; MUT, mutant-type; +RAS.P, FN tumors with RAS pathway gene mutations; -RAS.P, FN tumors without RAS pathway gene mutations.
