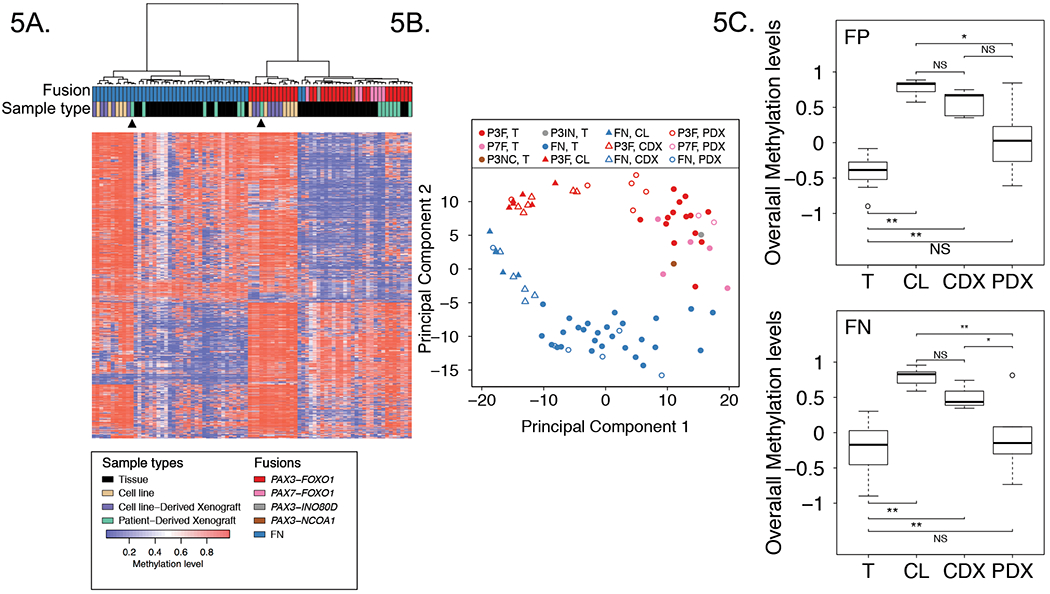
Figure 5. Comparison of methylation profiles of RMS cell lines, CDXs, PDXs and patient tumors.

Heat map (A) and PCA (B) analyses comparing DNA methylation profiles of 11 RMS cell lines, 11 CDXs, 14 PDXs and 48 patient tumors in the discovery cohort based on top 1% most varied DNA methylation probes across patient tumors. Arrowheads from left to right denote RH36 PDX and RH41 PDX. C, Overall DNA methylation levels in RMS cell lines, CDXs, PDXs and patient tumors. Data for FP samples are shown above, and data for FN samples are shown below. The plots summarize the distribution of standardized average DNA methylation levels in each sample type based on the top 1% most varied probes across RMS tumors. Adjusted P values in FP samples were calculated using one way ANOVA with Games-Howell test, and adjusted P values in FN samples were calculated using one way ANOVA with Tukey-Kramer multiple comparison post hoc test. Abbreviations: P3F, PAX3-FOXO1; P7F, PAX7-FOXO1; P3IN, PAX3-INO80D; P3NC, PAX3-NCOA1; T, tumor; CL, cell line. *, P<0.05; **, P<0.01; NS, not significant.
