Fig. 1.

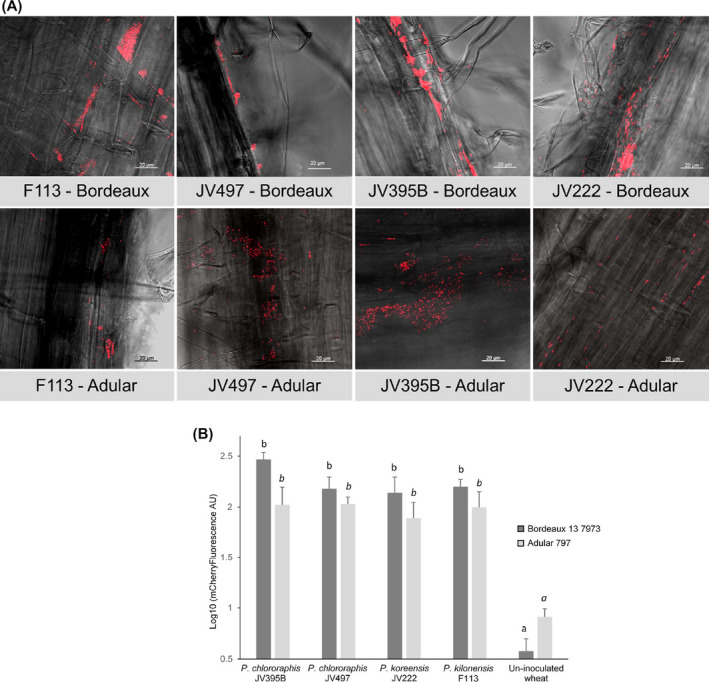
Confocal laser microscopy images (A) and semi‐quantitative analysis (B) of root colonization by P. kilonensis F113, P. chlororaphis JV497 and JV395B and P. koreensis JV222 on wheat genotypes Bordeaux 13 7973 and Adular 797, 7 days after bacterial inoculation. Photographs (A) were taken using a confocal laser scanning microscope with an excitation of 561 nm and an emission filter of 570–636 nm. Cells expressing mCherry are red and grey backgrounds correspond to root views observed with transmitted light. Images are representative of the analysis of 15 images per condition. Scale bars measure 20 µm. Root colonization (B) was estimated by quantifying the mCherry fluorescence recovered from roots, with an Infinite M200 PRO microplate reader using an excitation wavelength of 587 nm, and an emission wavelength of 661 nm. For all strains, significant higher levels of fluorescence were measured in the inoculated plants than in the un‐inoculated plants (Kruskal and Wallis test, P‐value < 0.05; different letters indicate significant differences).
