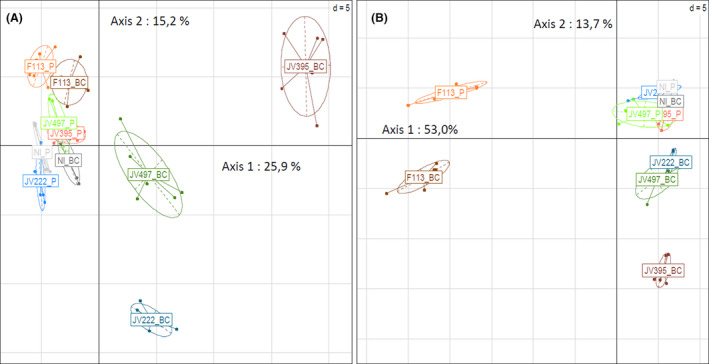
Fig. 2.

Principal component analysis of LC‐HRMS data obtained for the four Pseudomonas strains cultivated in planktonic (P) or in biofilm colony (BC) conditions after 6 days of incubation, based on intensity of ions (expressed in log10) in positive (A) and negative (B) modes. Relationships between metabolomes of the 4 fluorescent Pseudomonas strains, P. chlororaphis JV395B and JV497, P. kilonensis F113 and P. koreensis JV222, according to lifestyles are visualized along principal components PC1 = 25.9% and PC2 = 15.2% (N = 60 samples; 186 molecular ions) for the positive mode (A) and PC1 = 53.0% and PC2 = 13.7% (N = 60 samples; 230 molecular ions) for the negative mode (B).
