Fig. 3.

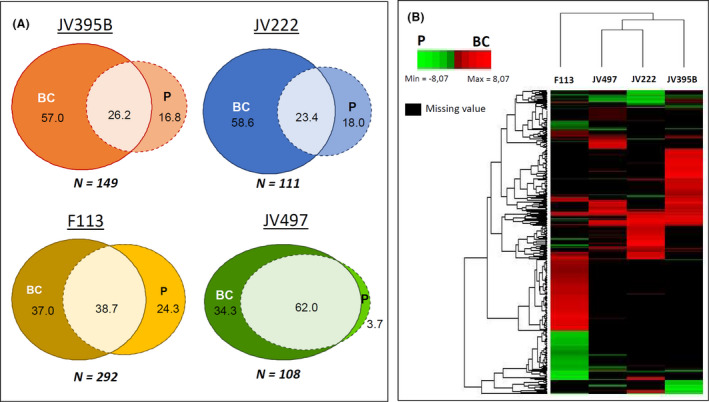
Venn diagrams representing the percentage of secondary metabolites significantly overproduced in biofilm colony (BC), planktonic (P) or shared between the two culture modes for each Pseudomonas strains, P. chlororaphis JV395B and JV497, P. kilonensis F113 and P. koreensis JV222 (P‐value < 0.05, Wilcoxon test) (A). Heatmap clustering of the secondary metabolites differentially produced in biofilm colony (red) or in planktonic (green) cultures (P‐value < 0.05, Wilcoxon test) (B). The map was generated using log2 fold change values calculated from the metabolome table matrix constituted of 328 m/z features.
