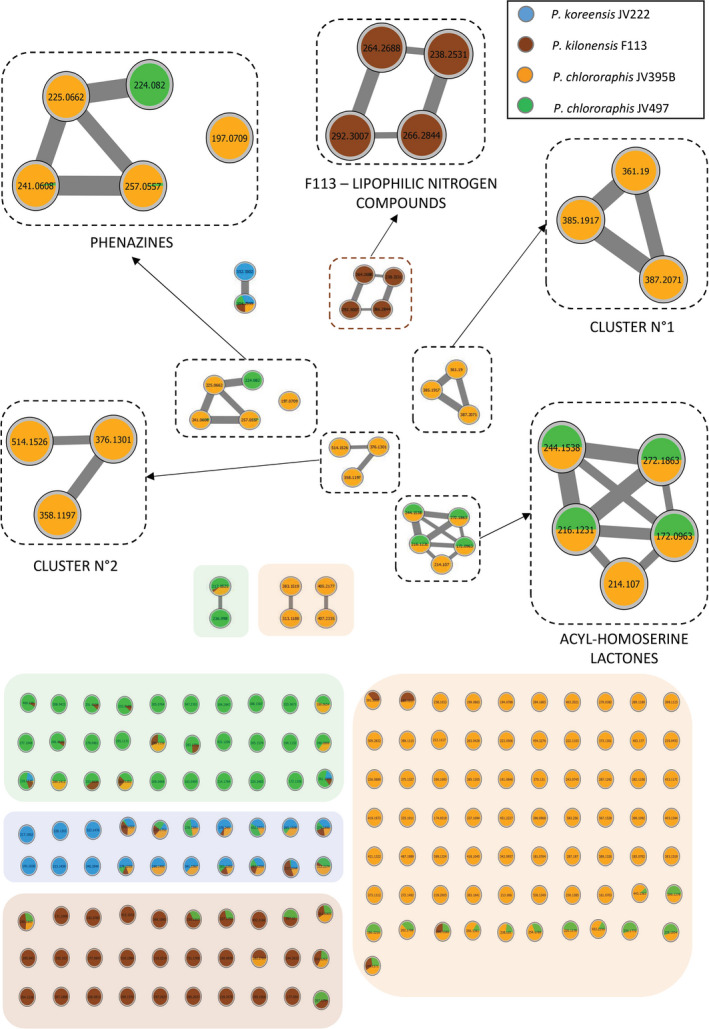
Fig. 4.

Molecular networks of MS/MS data obtained from biofilm cultures of the four bacterial strains P. chlororaphis JV395B (orange), P. chlororaphis JV497 (green), P. kilonensis F113 (brown) and P. koreensis JV222 (blue), using a cosine similarity cut‐off of 0.6. Cluster position was determined according to t‐distributed stochastic neighbour embedding (t‐SNE) output. Nodes are labelled with parent m/z ratio. Relative proportion of the compounds belonging to each strain was represented as a pie chart in each node. This figure highlights that most single ions from the 4 Pseudomonas strains in biofilms (i.e. P. chlororaphis JV395B (orange box), P. chlororaphis JV497 (green box), P. kilonensis F113 (brown box) and P. koreensis JV222 (blue box)) are unique to each strain. Clusters constituted of more than 3 ions are emphasized.
