
Fig. 1.
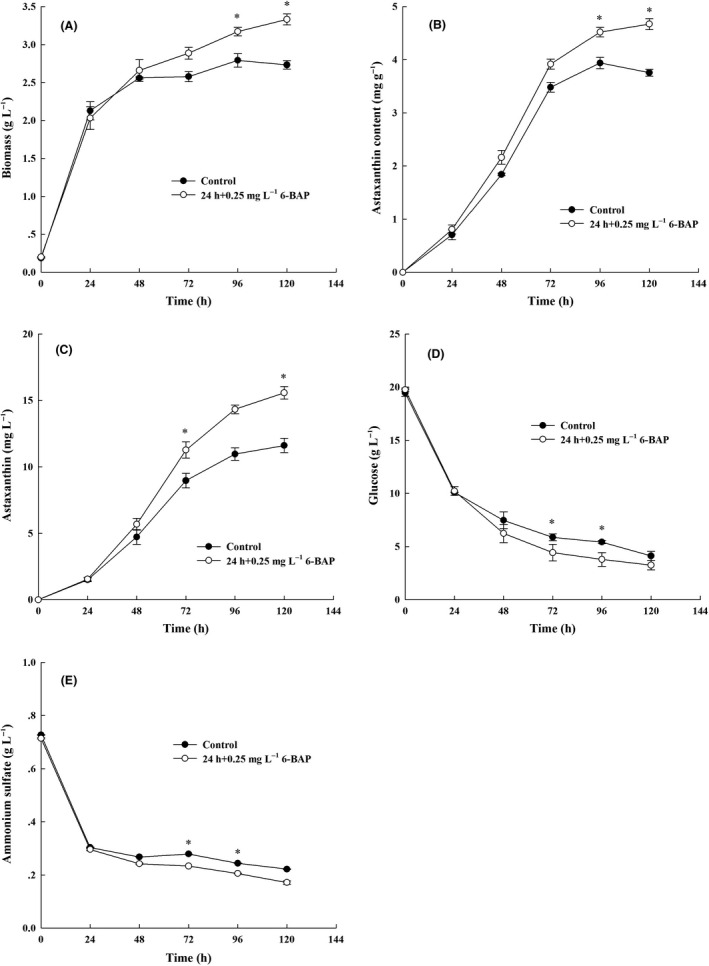
Time‐course profiles of X. dendrorhous UV3‐721 cultures in the 6‐BAP and control groups. Control group: solid circle symbols, 6‐BAP group: hollow circle symbols. (A) Biomass (g l−1); (B) astaxanthin content (mg g−1); (C) astaxanthin (mg l−1); (D) glucose (g l−1); (E) ammonium sulfate (g l−1), where * represents statistical differences with P < 0.05 compared with the control. Values are mean ± standard deviation of three independent experiments.