
Fig. 6.
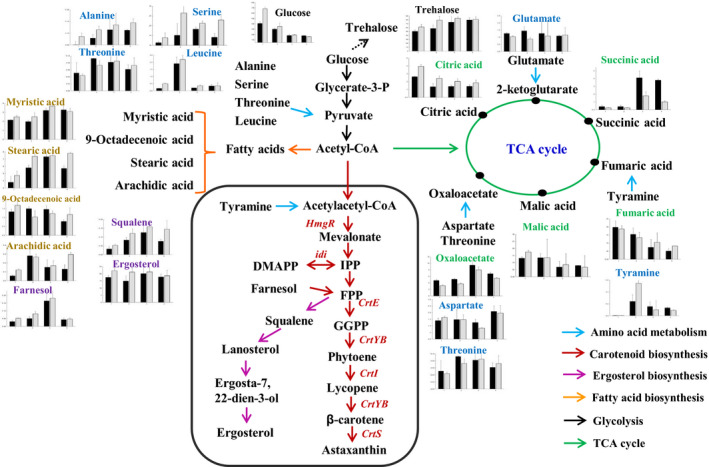
Metabolites change induced by 6‐BAP in X. dendrorhous UV3‐721. Change in the levels of intermediates was detected by GC‐MS and calculated by normalization of the peak area of each metabolite to the internal standard. The x‐axis in the graphs represents time (h), and the y‐axis represents concentration (mg g−1 DCW). The black and grey bars represent metabolites in the control and 6‐BAP treatment groups respectively. The red font indicates the key genes of carotenoid biosynthesis.