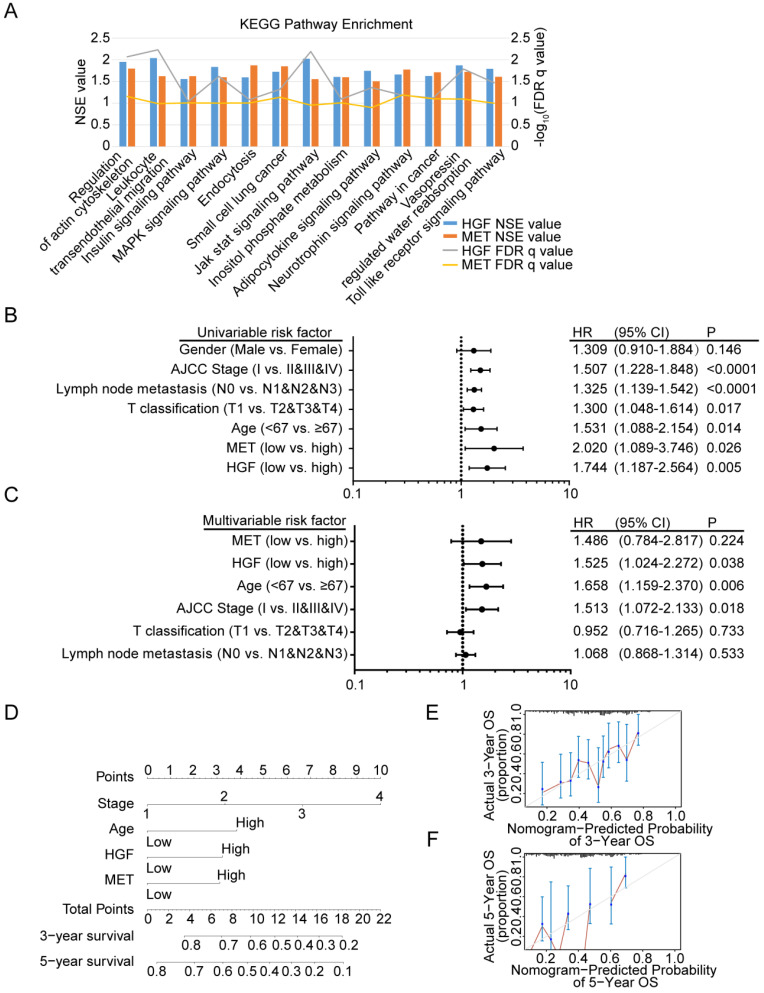
Figure 5.
Diagnostic model based on HGF and c-MET mRNA expression in gastric cancer patients. A. The diagram shown the 13 shared KEGG pathways enriched by HGF high expressed gastric cancer tissues and c-MET high expressed gastric cancer tissues. B. Univariate analysis was performed in gastric cancer cohort based on TCGA database. The bar corresponds to 95% confidence intervals. C. Multivariate analysis was performed in gastric cancer cohort based on TCGA database. The bar corresponds to 95% confidence intervals. D. The nomogram was utilized by adding up of the points identified on the points scale for each variant. The total points occurred on the bottom scales represent the probability of 3- and 5-year survival. E&F. The calibration curve for predicting OS at 3- and 5-years in gastric cancer cohort based on TCGA database.

