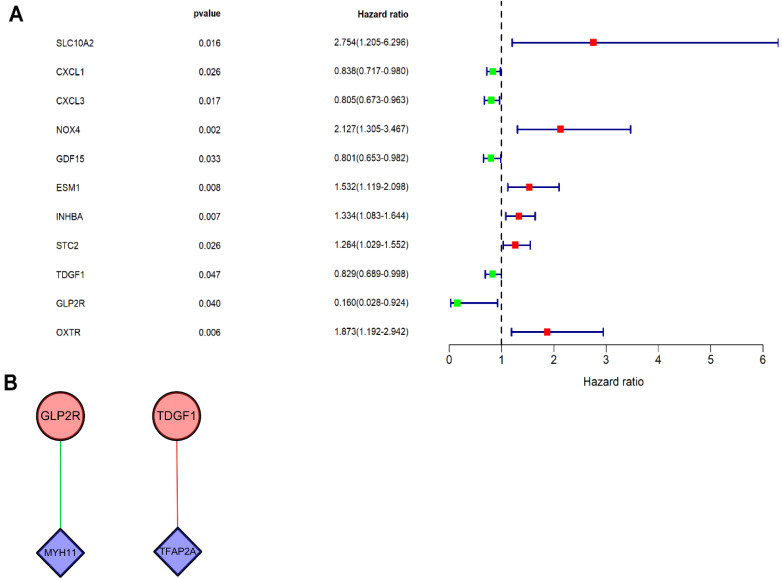
Figure 4.
Univariate Cox regression analysis and TF regulatory network. (A) Forest plot demonstrated the risk classification of 11 prognosis-related IRGs, including six high-risk prognosis-related IRGs (HR>1) and five low-risk prognosis-related IRGs (HR<1). The red squares and green squares indicate the high-risk and low-risk prognosis-related IRGs, respectively. (B) The network revealed the relationship of DETFs with prognosis-related IRGs. Purple rhombuses represent DETFs, blue circles represent prognosis-related IRGs, and the red and green lines represent positive and negative correlation, respectively.

