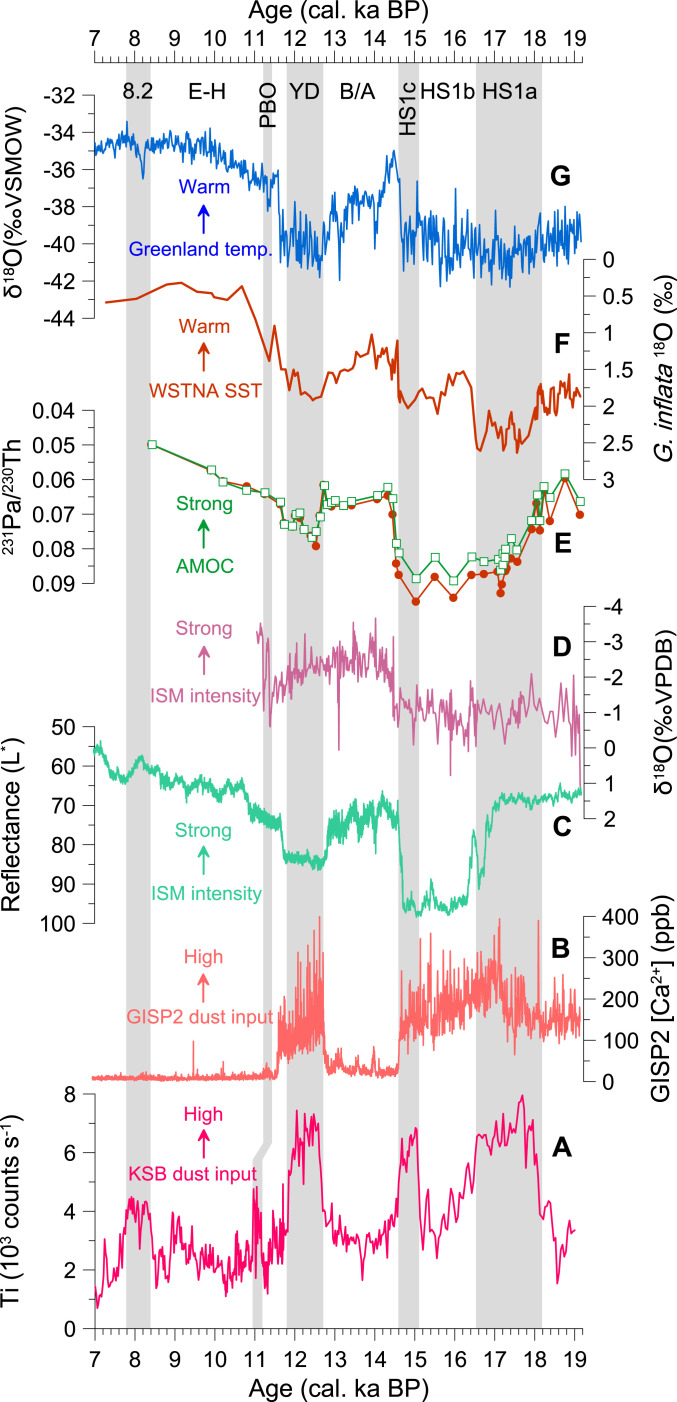
Fig. 3.
(A, this study) Comparison of the KSB Ti record from SE Iran, representing the West Asian dust plume with paleoclimate records from Greenland ice cores, the North Atlantic Ocean and the ISM region. (B) Ca2+ concentration from Greenland Ice Sheet Project (GISP) 2 ice cores (22) as a proxy for dust input in Greenland. (C) Sediment color reflectance of core SO130-289KL from the northeast Arabian Sea (10) as a proxy for ISM intensity. (D) Speleothem δ18O record from Socotra, Yemen (8) as a proxy for ISM intensity. (E) 231Pa/230Th ratio from the subtropical North Atlantic (1) as a proxy for the AMOC. (F) Subtropical North Atlantic planktic foraminifera (Globorotalia inflata) δ18O from sediment core GGC5 (1) as a proxy for SST. (G) North Greenland Ice Sheet project (NGRIP) δ18O values in ‰ Vienna Standard Mean Ocean Water (SMOW) on the Greenland Ice Core Chronology 2005 (GICC05) (21) as a proxy for Greenland temperature. B/A, Bølling–Allerød interstadial; E-H, Early Holocene; HS1, Heinrich Stadial 1; PBO, Preboreal oscillation; YD, Younger Dryas stadial; and 8.2, the 8.2-ka event.

