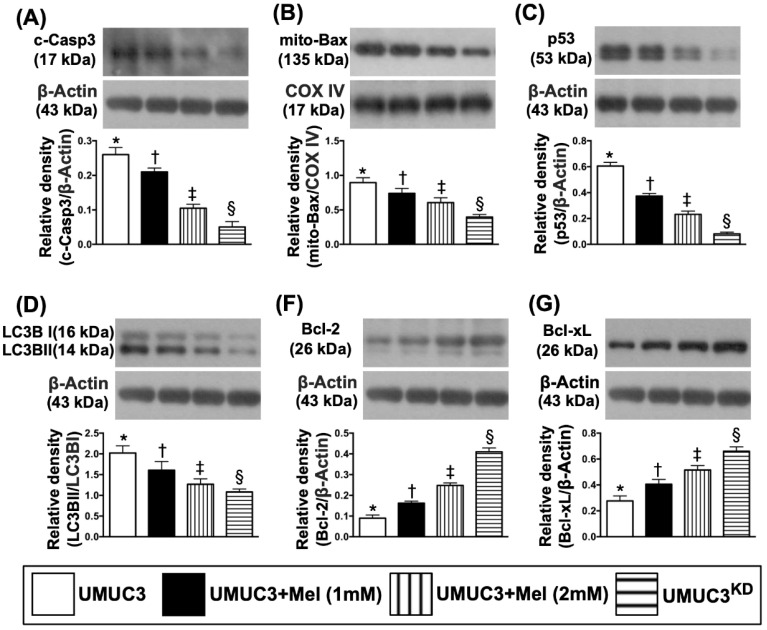
Figure 5.
Impact of stepwise increase in concentrations of Mel on protein expressions of apoptosis and autophagy in UMUC3 cells. A) Protein expression of cleaved caspase 3 (c-Casp3), * vs. other groups with different symbols (†, ‡, §), p<0.0001. B) Protein expression of mitochondrial (mito)-Bax, * vs. other groups with different symbols (†, ‡, §), p<0.0001. C) Protein expression of p53, * vs. other groups with different symbols (†, ‡, §), p<0.0001. The ratio of LC3B-II/LC3B-I protein expression, * vs. other groups with different symbols (†, ‡, §), p<0.0001. D) Protein expression of Bcl-2, * vs. other groups with different symbols (†, ‡, §), p<0.0001. E) Protein expression of Blc-xL, * vs. other groups with different symbols (†, ‡, §), p<0.0001. All statistical analyses were performed by one-way ANOVA, followed by Bonferroni multiple comparison post hoc test (n=4 for each group). Symbols (*, †, ‡, §) indicate significance (at 0.05 level). Mel = melatonin; SV-HUC1 = normal bladder cell line; UMUC3 = bladder cancer cell line; KD = knockdown; UMU3KD = double KD of Notch/JAG2 gene (i.e., KDNotch/JAG2) in UMU3 cells.

