Figure 6.
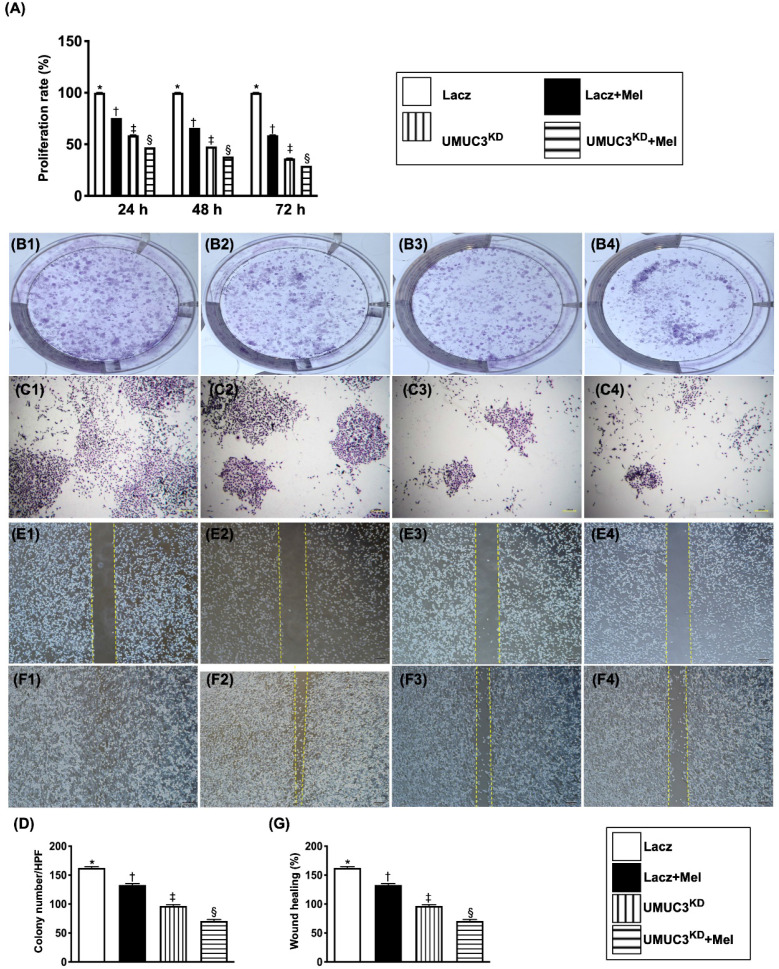
Melatonin treatment and double KDNotch/JAG2 gene suppressed proliferation/survival rate, colony formation and migration of UMUC3 cells. A) Illustrating the results of MTT assay for determining the proliferation/survival rate of UMUC3 cells under Mel treatment (2.0 mM) or in condition of KDNotch/JAG2 gene expression, by 24, 48 and 72h after cell culture, respectively. * vs. other groups with different symbols (†, ‡, §), p<0.001 at 24h (green bar chart), at 48h (yellow bar chart) and 72 (blue bar chart) cell culturing respectively. B1 to B4 and C1 to C4) Illustrating the microscopic finding at 0h (i.e., B1 to B4) (1x, in culture plate) and 24h (i.e., C1 to C4) (40x) for identification of the colony formation (cell numbers: 2 x 10³/well) in the four groups. D) Analytical result, * vs. other groups with different symbols (†, ‡, §), p<0.001. E1 to E4 and F1 to F4) Illustrating the microscopic finding (40x) at 0h (i.e., E1 to E4) and 24h (i.e., F1 to F4) for identification of “wound healing” process (cell amount: 3.5 x 10⁴/well) among the four groups. G) Analytical results % of wound healing at 24h, * vs. other groups with different symbols (†, ‡, §), p<0.001. The formula for calculation of wound healing process (%) = cell migrated area at 24h/the original migrated area at 0h. All statistical analyses were performed by one-way ANOVA, followed by Bonferroni multiple comparison post hoc test (n=3 for each group). Symbols (*, †, ‡, §) indicate significance (at 0.05 level). Lacz = control; Mel = melatonin; UMUC3 = bladder cancer cell line; KD = knockdown; UMU3KD = double KD of Notch/JAG2 gene (i.e., KDNotch/JAG2) in UMU3 cells.

