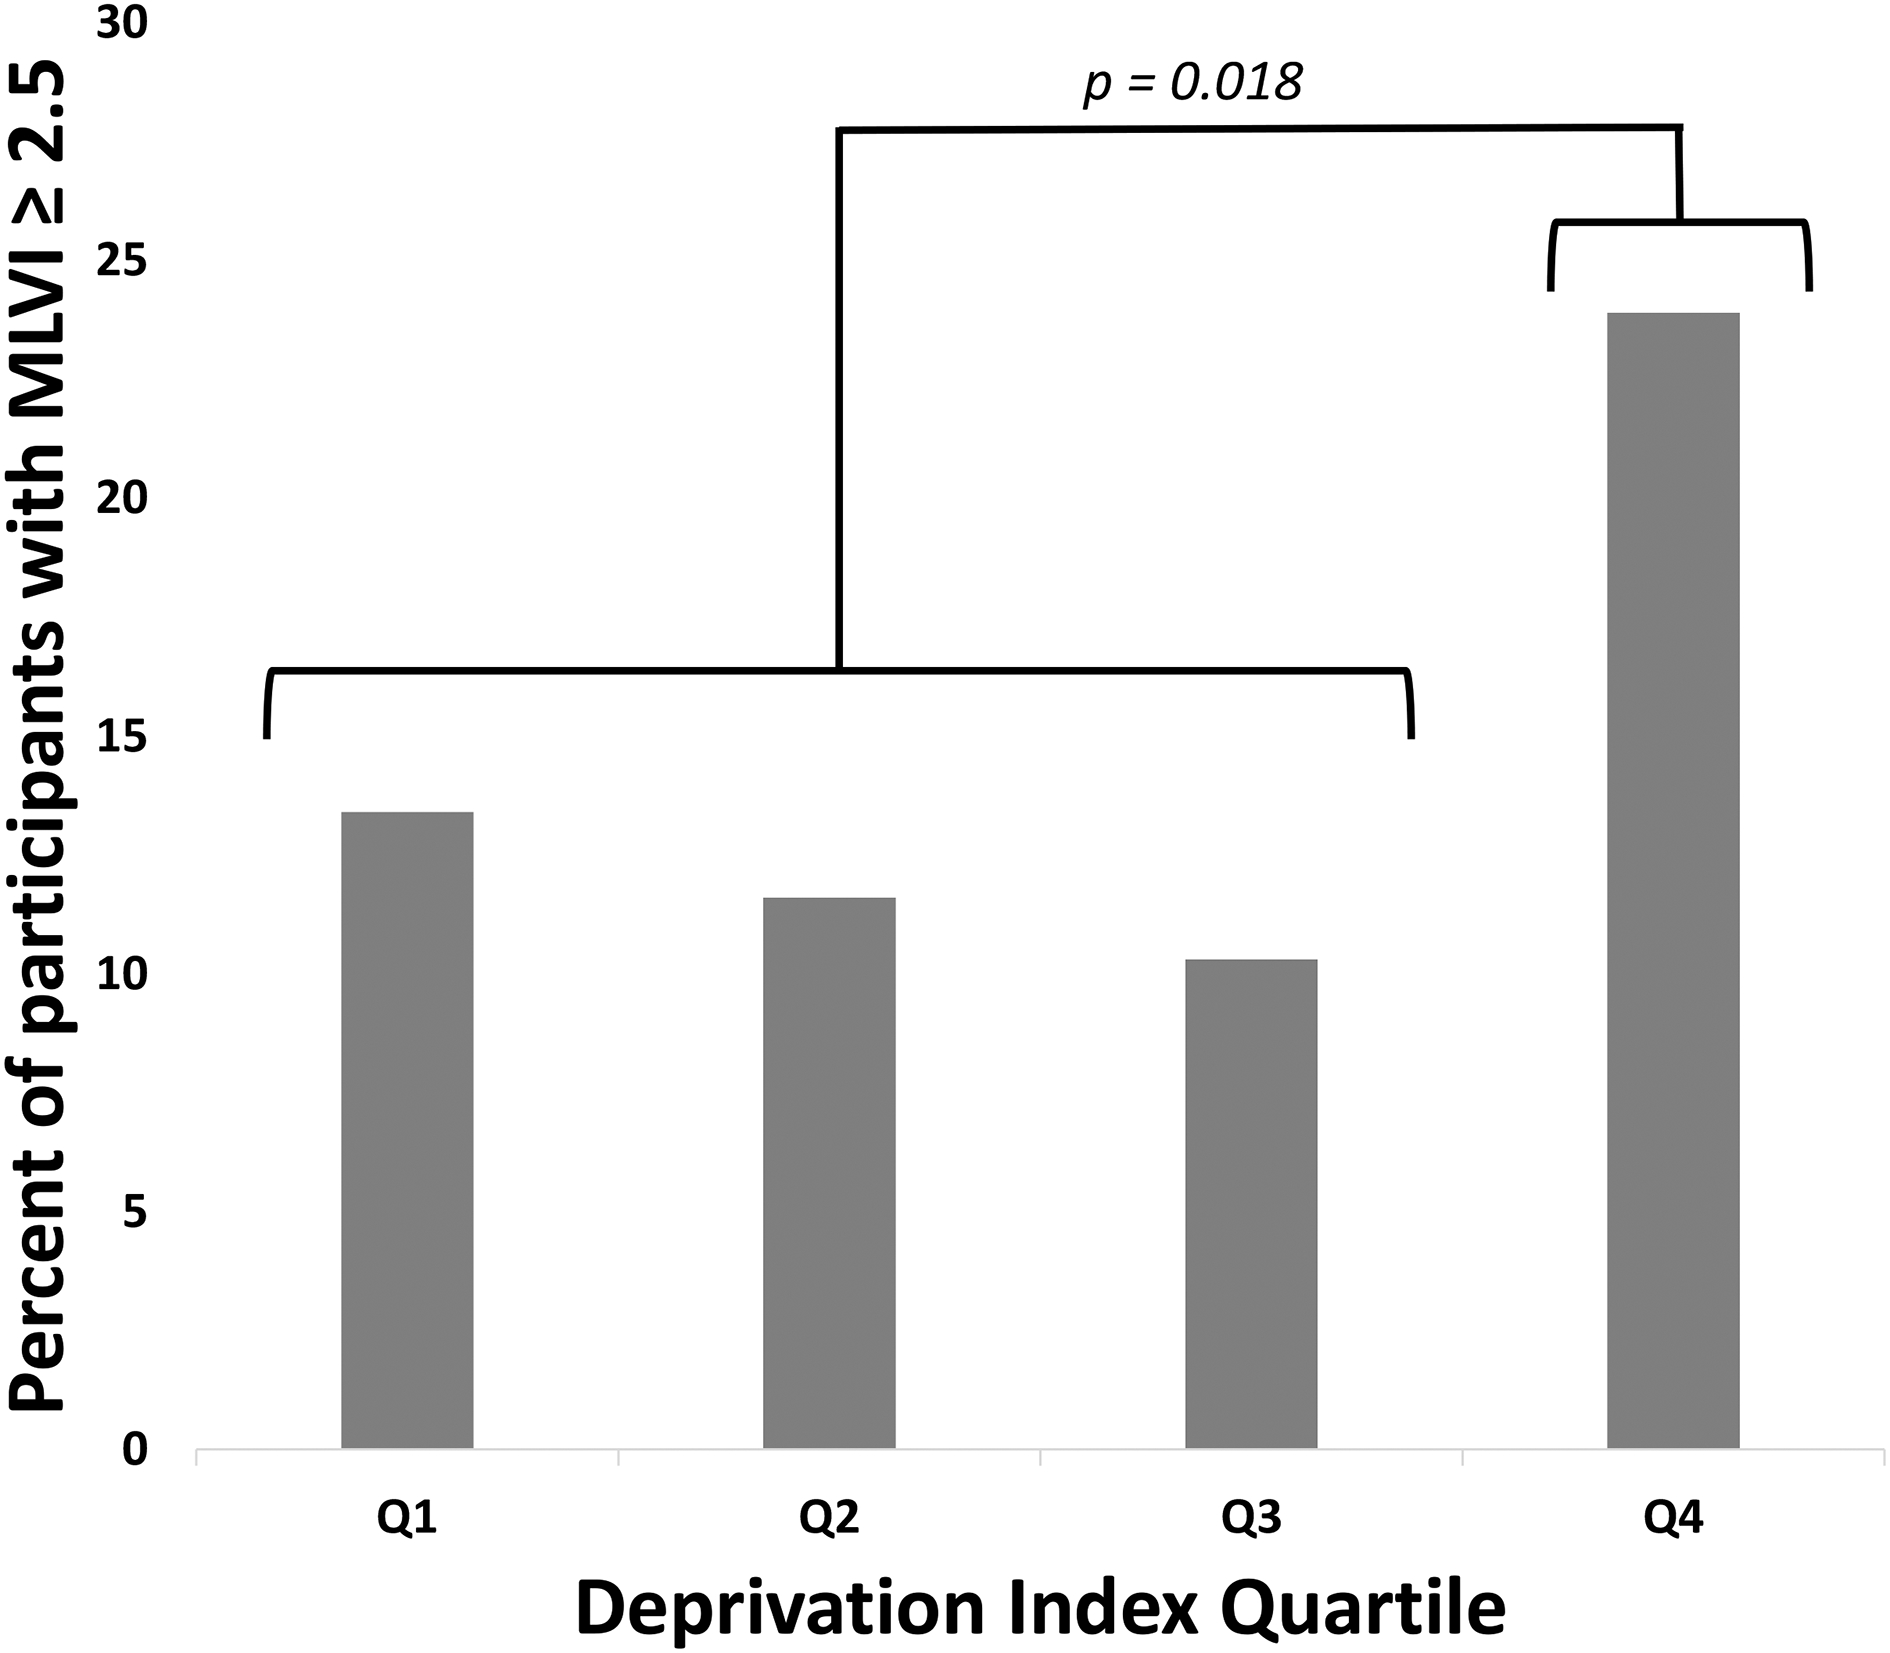
Figure 1. Percent of participants with an MVLI ≥ 2.5 by deprivation index quartiles.

Q1: Quartile 1 (0 – 0.27, n = 67); Q2: Quartile 2 (0.27 – 0.34, n = 69); Q3: Quartile 3 (0.34 – 0.47, n = 68); Q4: Quartile 4 (0.47– 1, n = 67); MLVI: Medication Level Variability Index; OR: Odds ratio
When evaluating for a trend across quartiles, Cochran-Armitage test was p = 0.12. Chi-square comparing the highest quartile to the rest of the cohort (23.9% vs. 11.8%, respectively) yielded a p = 0.018.
