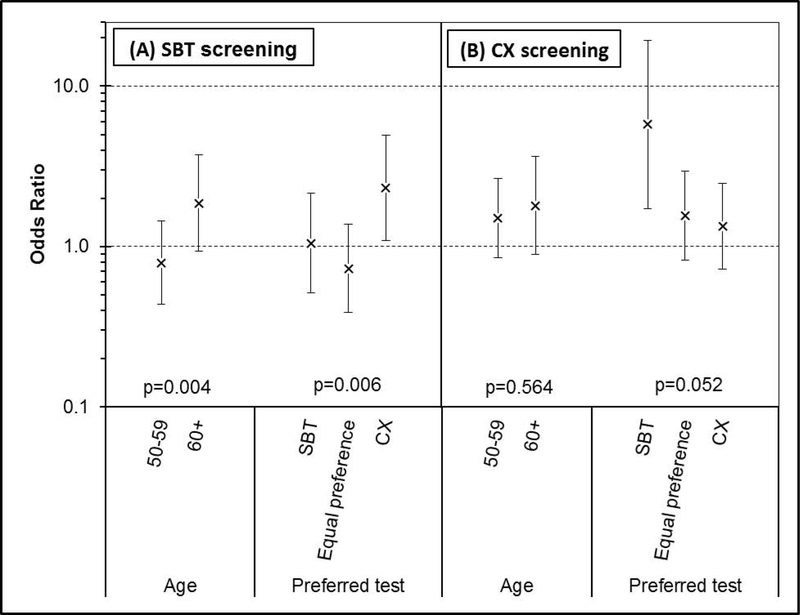
Figure 2.
Adjusted odds ratio for race (African Americans versus whites) with respect to test-specific screening adherence, within subgroups defined by age and preferred screening test.
(A) Results for stool blood test performance (vs. no screening).
(B) Results for colonoscopy completion (vs. no screening).
P-values shown are for the interaction of race with each predictor (age or preferred test).
SBT: stool blood test. CX: colonoscopy.

