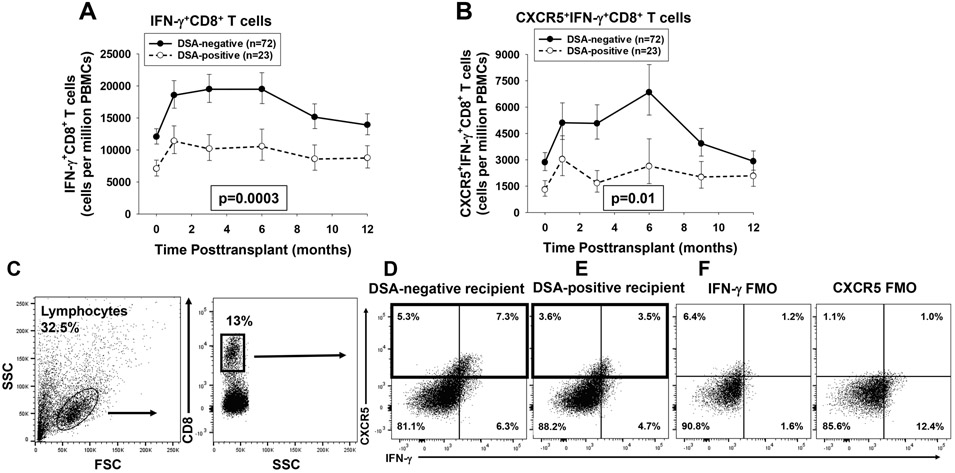
Figure 2. DSA-positive recipients have significantly lower quantity of peripheral blood IFN-γ+CD8+ T cells and CXCR5+IFN-γ+CD8+ T cells than DSA-negative recipients.
Peripheral blood from DSA-positive recipients (n=23) and DSA-negative recipients (n=72) was analyzed using flow cytometry to determine the quantity of IFN-γ+CD8+T cells and CXCR5+IFN-γ+CD8+ T cells. A) IFN-γ+CD8+ T cells were significantly lower in quantity (1.6 to 1.9 fold) in DSA-positive recipients over the first year posttransplant (p=0.0003). B) CXCR5+IFN-γ+CD8+ T cells were also significantly lower in quantity (1.4- to 3.0-fold) in the DSA-positive recipients (p=0.01). Graphed data represents geometric mean ± standard error. C) Representative flow plots were initially gated on lymphocytes and CD8+ T cells. D) A flow plot for a representative DSA-negative recipient (3 months posttransplant) shows that CXCR5+CD8+ T cells comprise 12.6% of the total peripheral CD8+ T cells (boxed area) and 58% of these were IFN-γ+. E) A flow plot for a representative DSA-positive recipient (3 months posttransplant) shows that CXCR5+CD8+ T cells comprise 7.1% of total peripheral blood CD8+ T cells (boxed area) and 50% of these were IFN-γ+. F) Flow minus 1 (FMO) controls were used for setting the positive gates and indicating background staining for IFN-γ and CXCR5.

