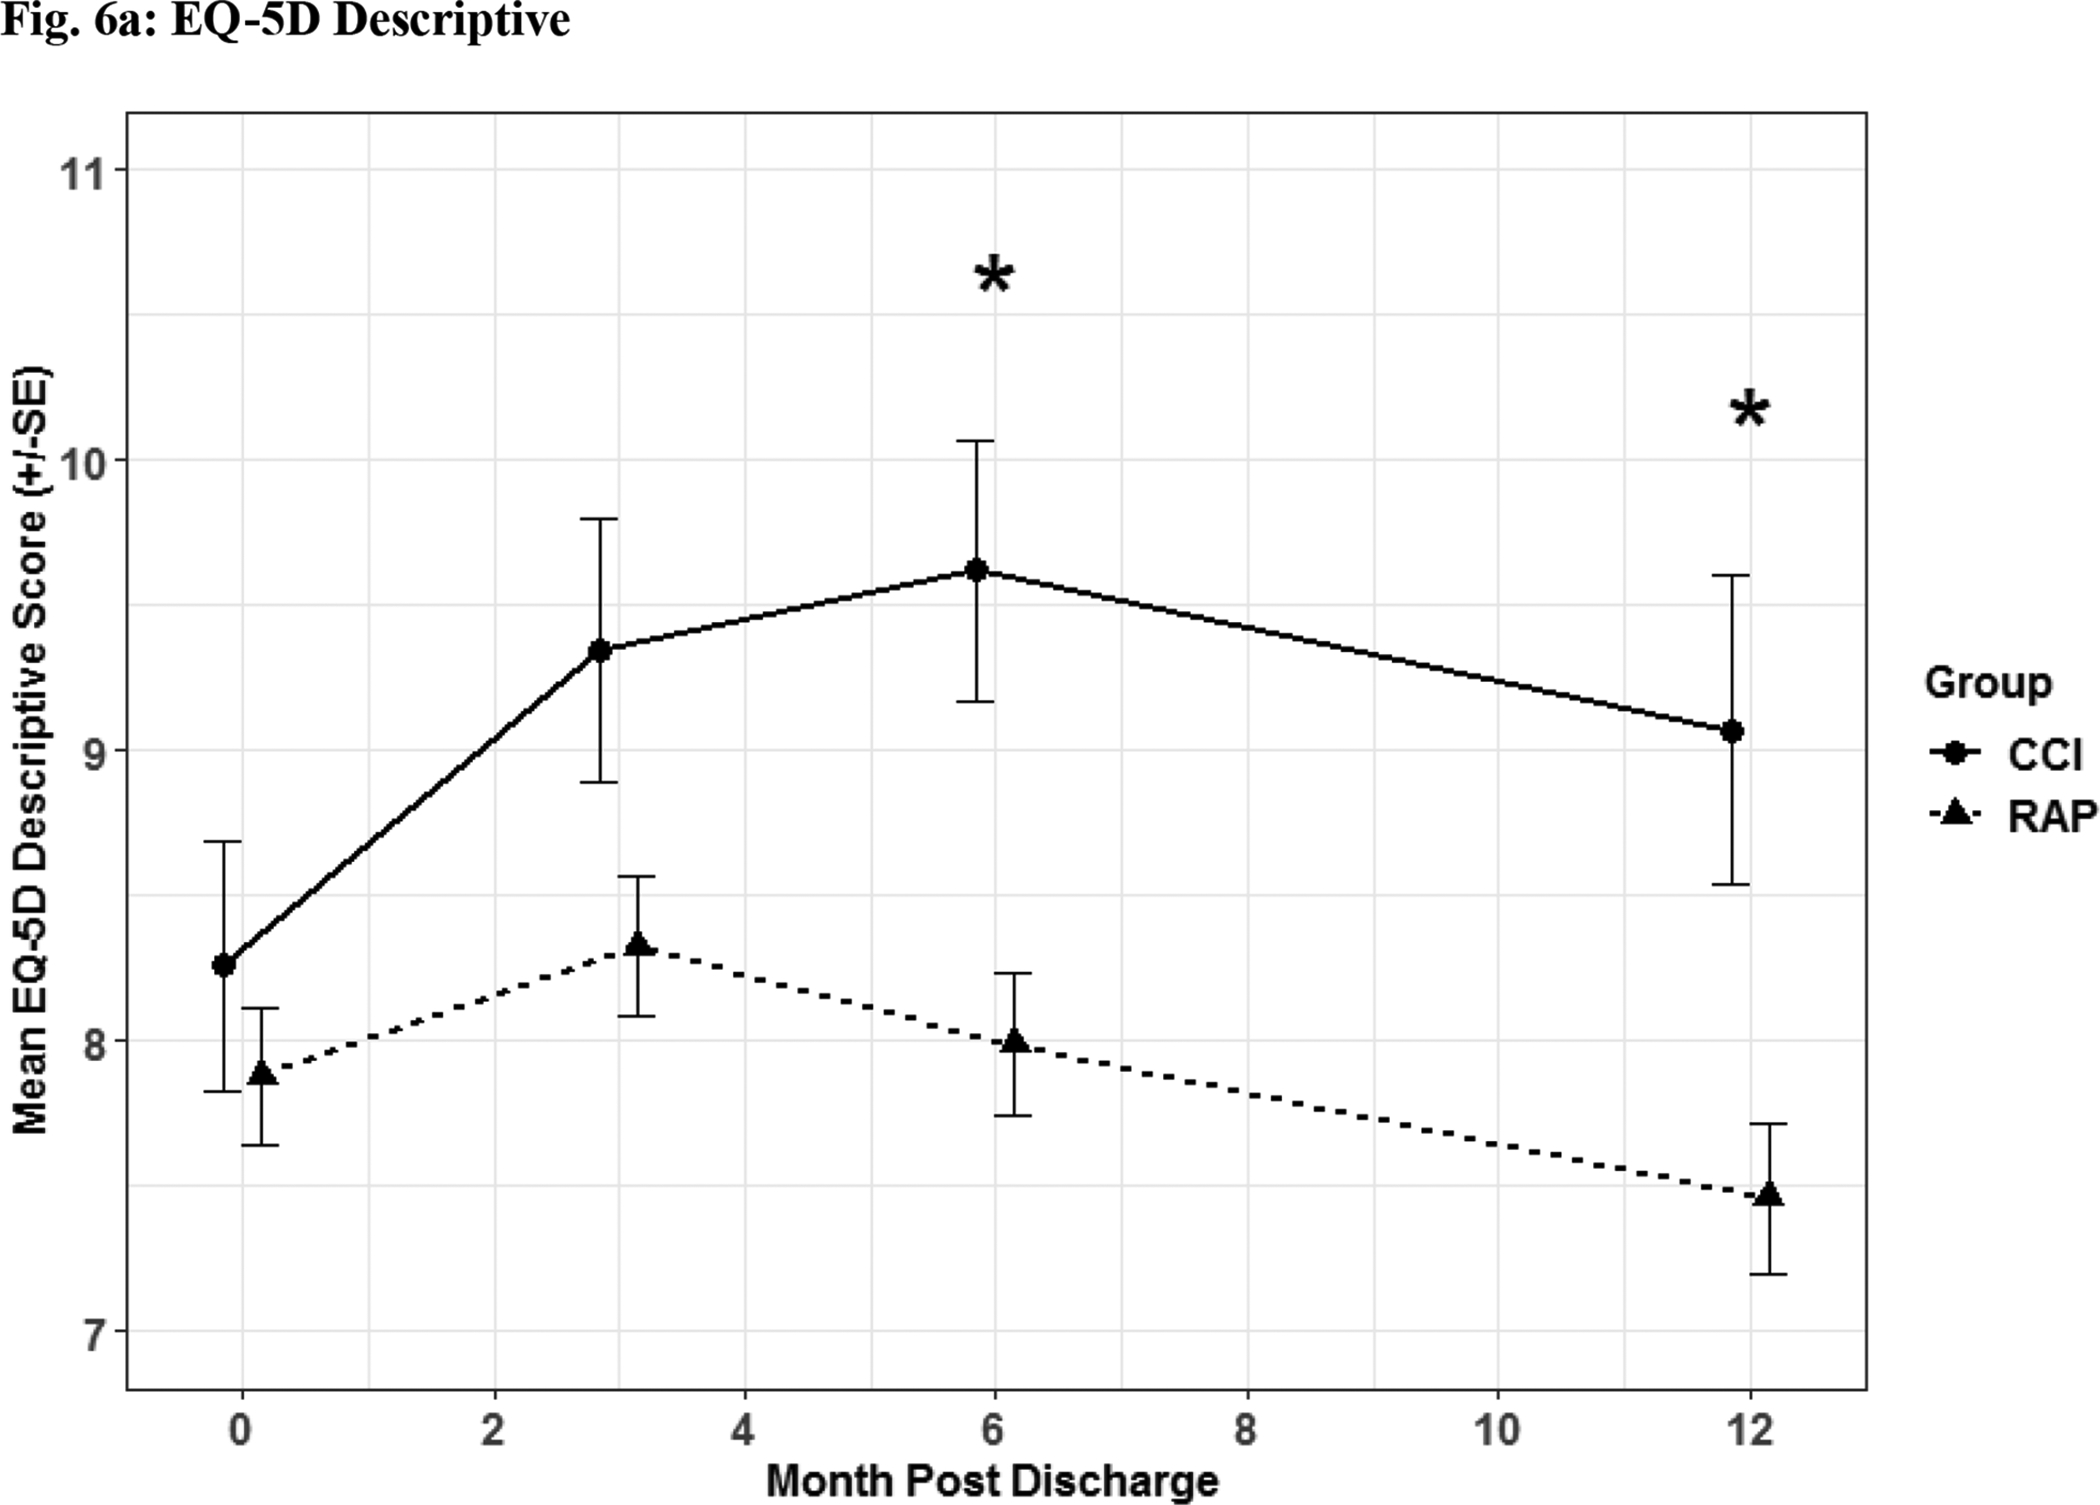
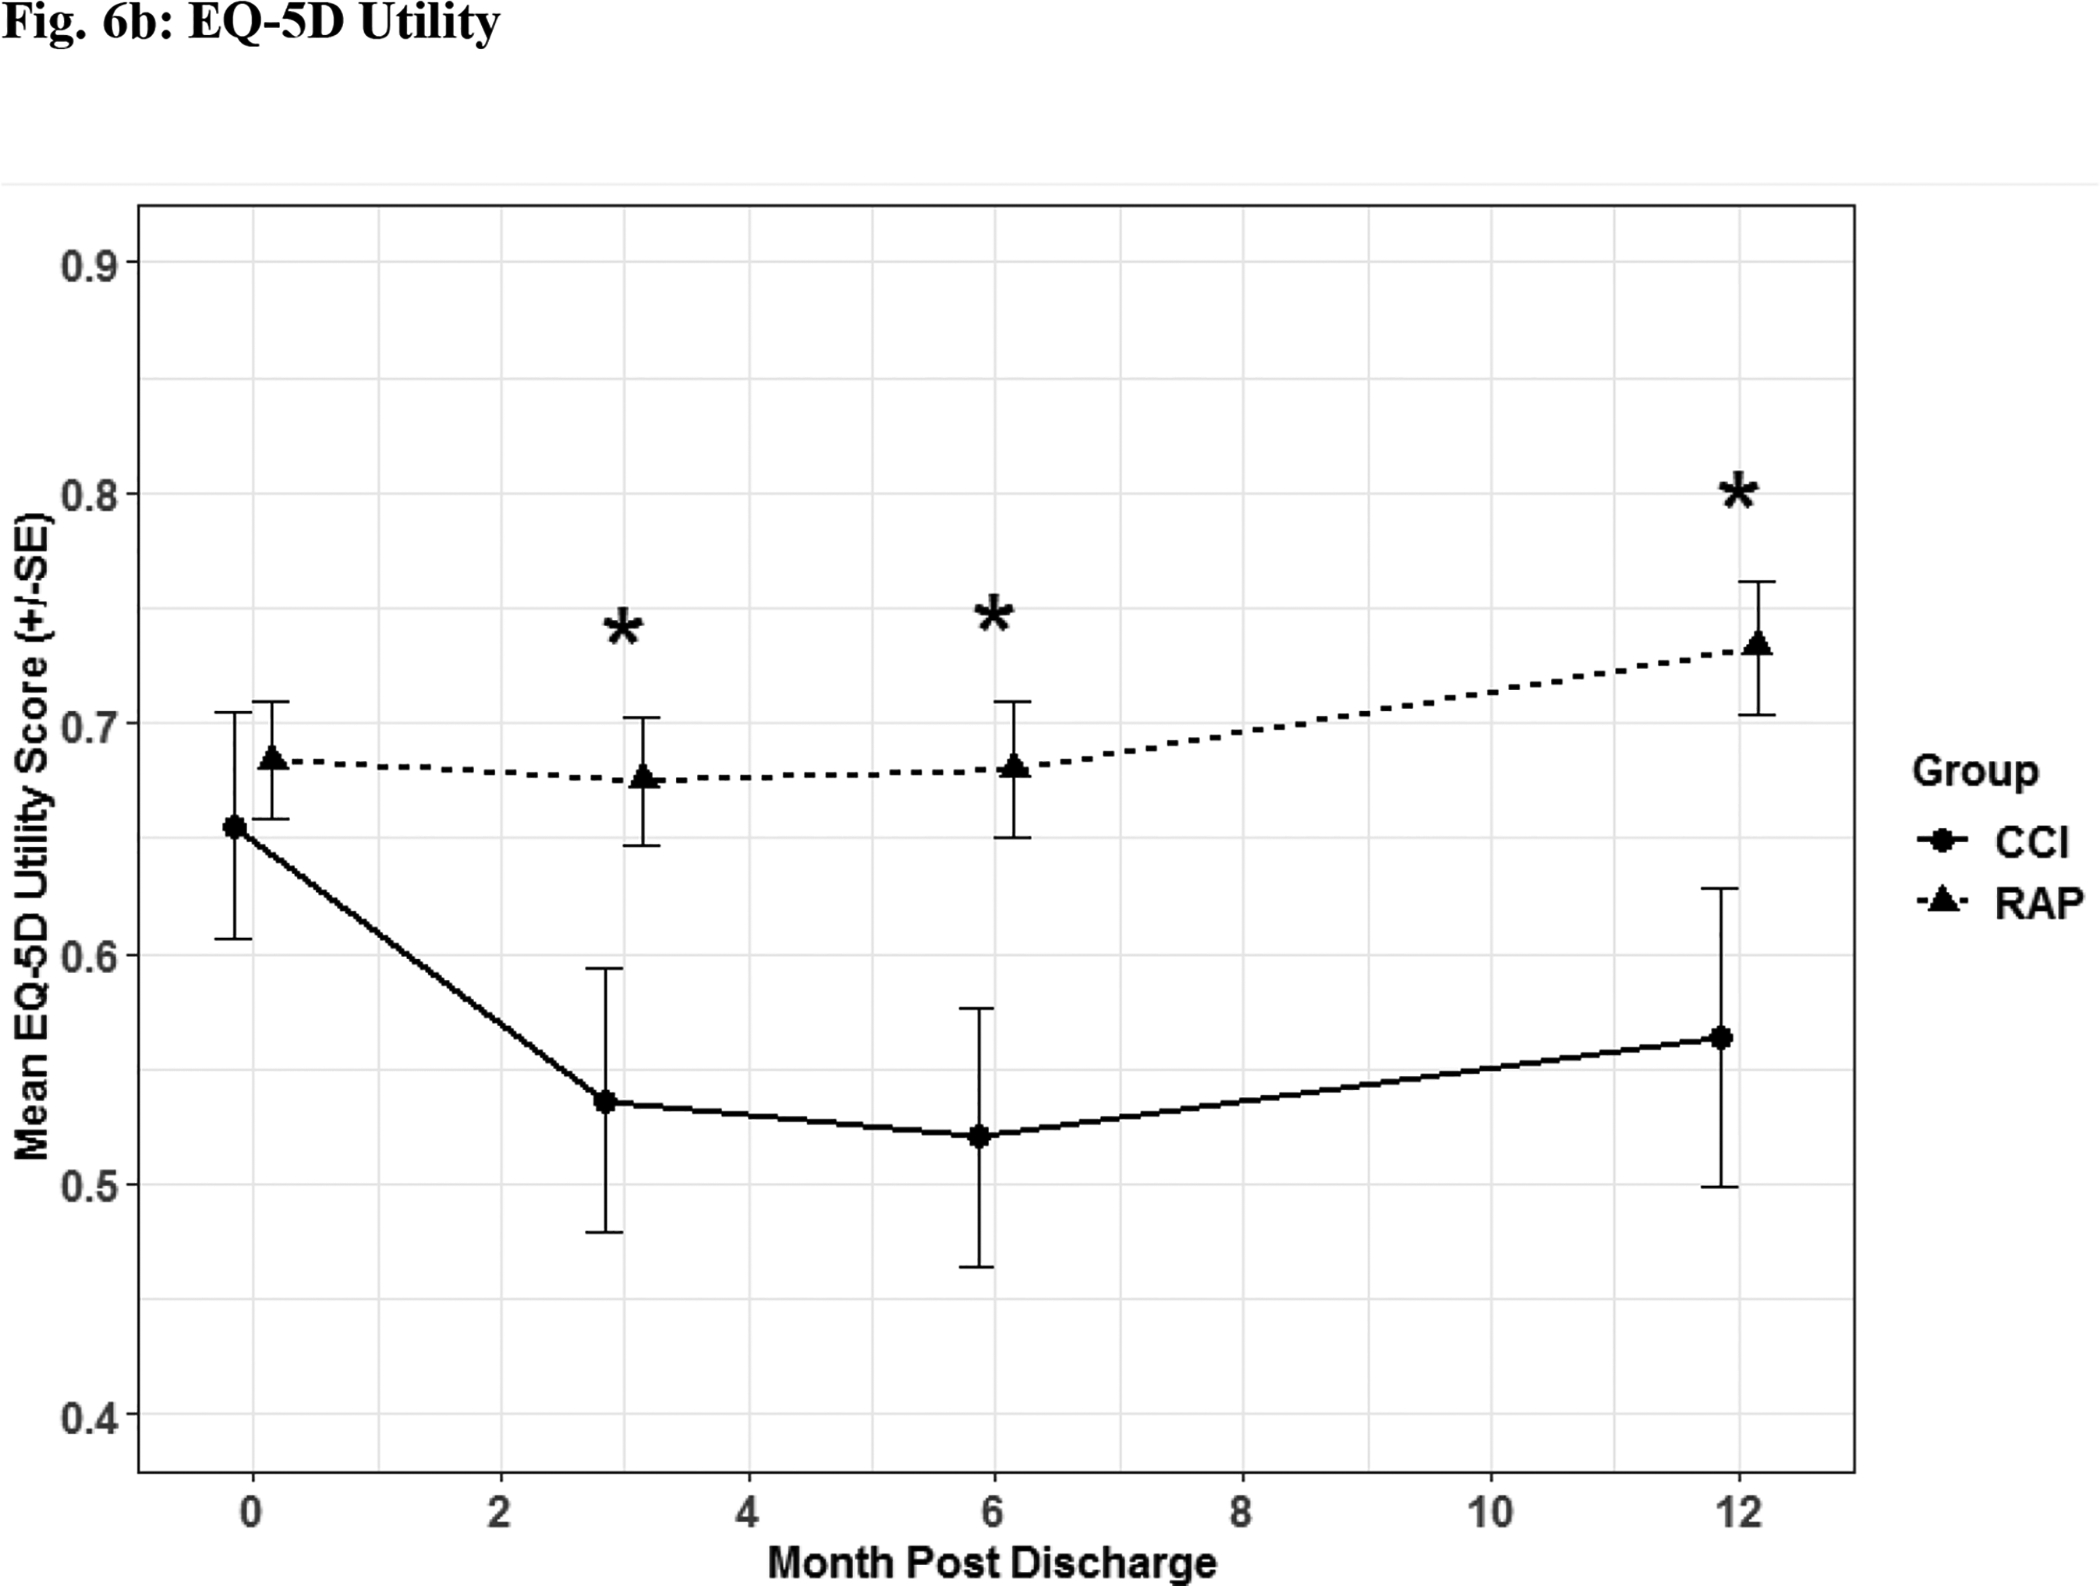
Fig. 6. Quality of Life Assessment.


Quality of life assessment by EQ-5D descriptive (Fig 6a) and utility (Fig 6b) depicted as the mean for each time point for the representative days post sepsis onset, as well as, (*) denoting statistical significance. The solid line is CCI and dashed is RAP.
