
Figure 2.
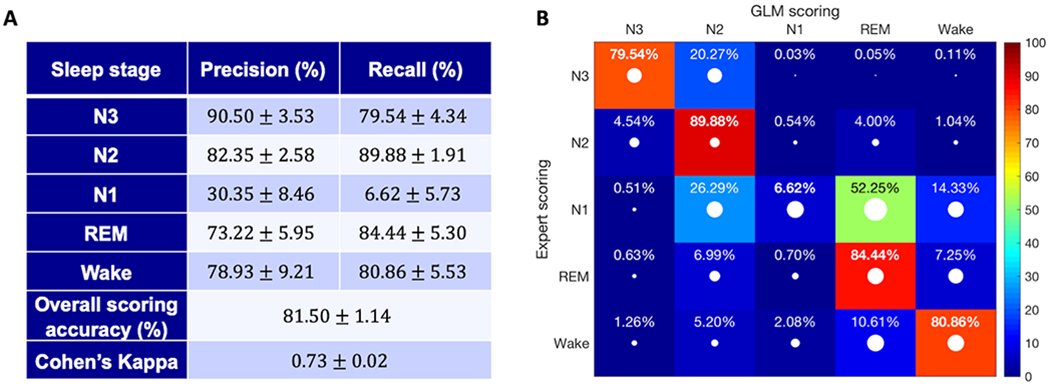
Scoring results of the test set. (a) Precision and recall (mean ± std) are reported for each sleep stage along with the overall scoring accuracy and Cohen’s kappa. (b) Confusion matrix for the automatic scoring algorithm. The values are the percentage of epochs (mean value) belonging to the stage scored by the expert (indicated by the rows) that were classified by our system as the stage indicated by the columns (recall). The white dots represent the standard deviation of the reported values. The diagonal elements, shown in bold, represent the percentage of epochs where the automatic classifier was in agreement with the human expert for each sleep stage.