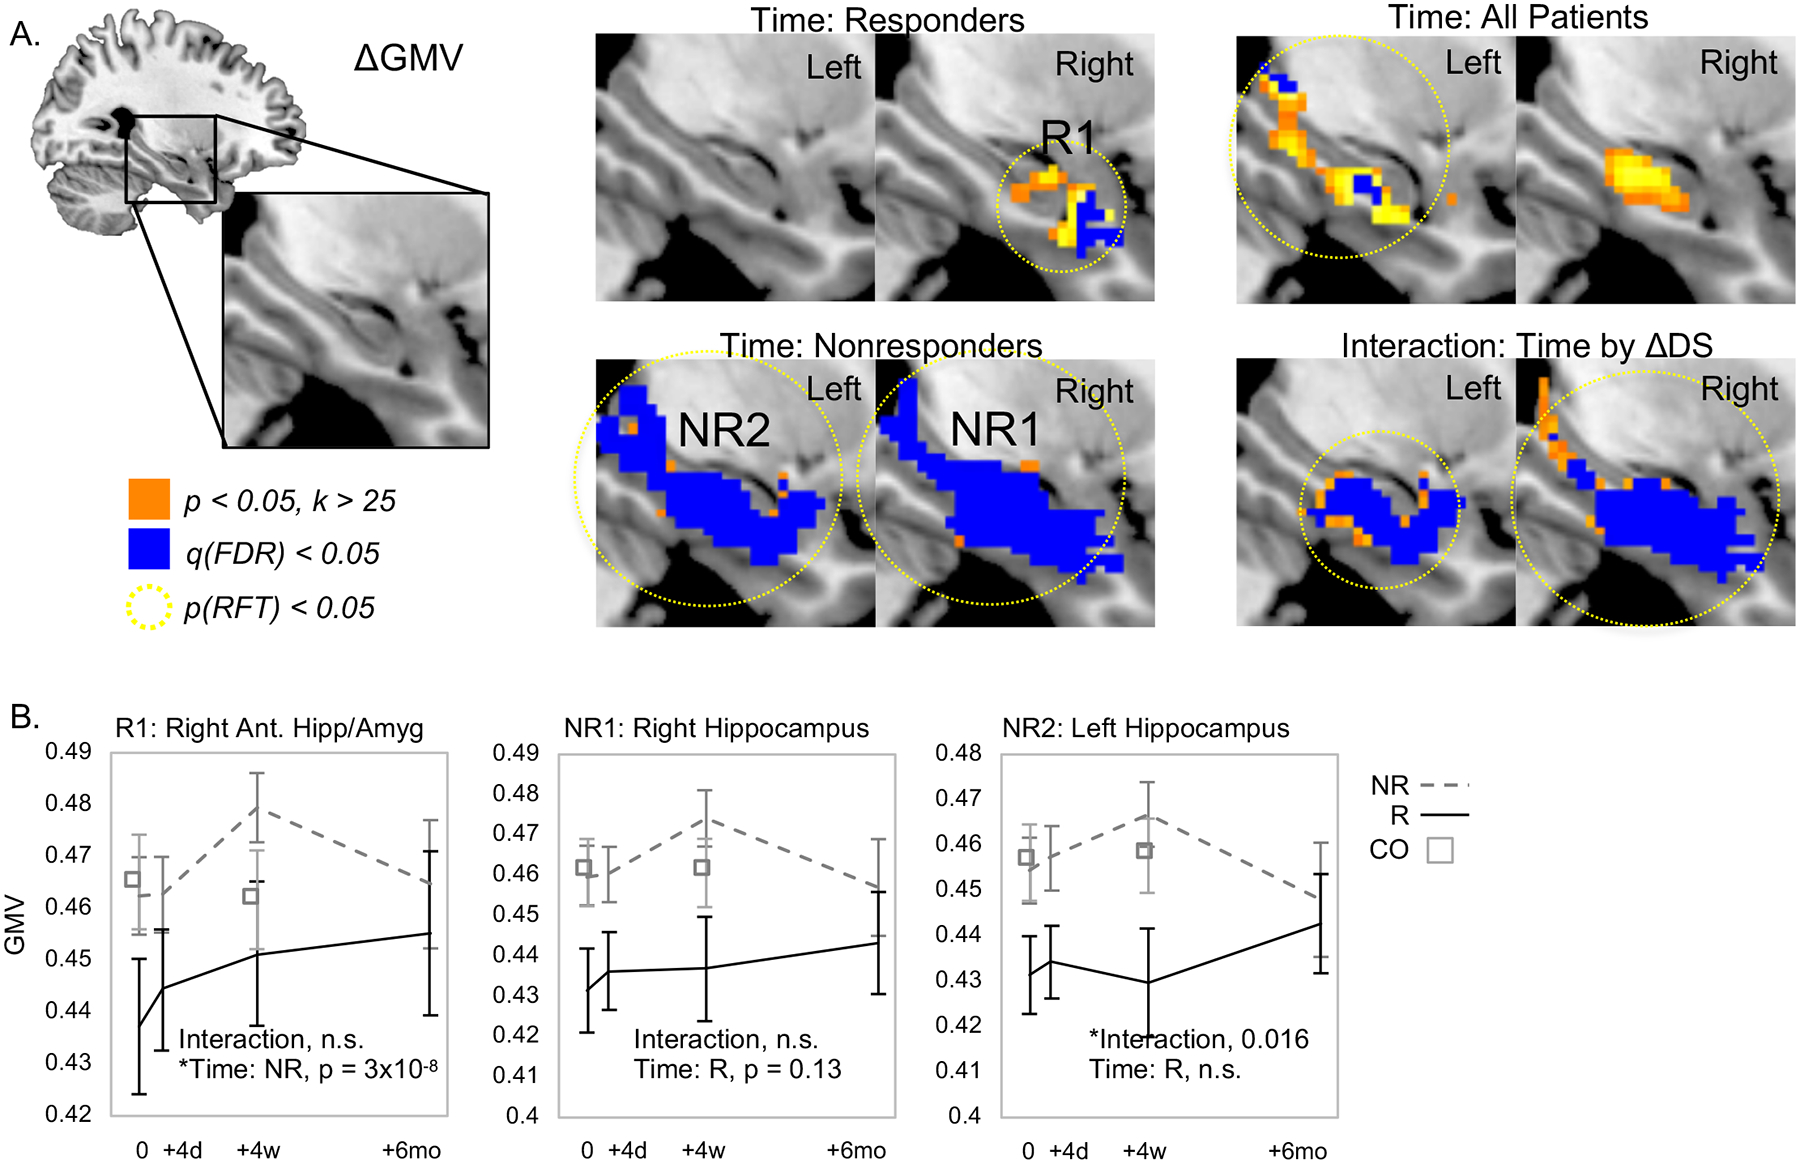
Figure 2.

Regional GMV increases after ECT in responders and nonresponders. A. GMV increased in right anterior hippocampus and amygdala in responders (top left) and throughout bilateral hippocampus in nonresponders after ECT (bottom left). Regions of increased GMV when analyzing all patients (upper right) and interactions between time and response (bottom right) area also displayed. B. Mean regional GMV is plotted for the significant results shown in A for clusters of GMV change identified in responders and for nonresponders. In each plot, data for responders is shown in black lines, nonresponders are plotted in dashed gray lines, and data from non-depressed control volunteers is plotted in open squares.
