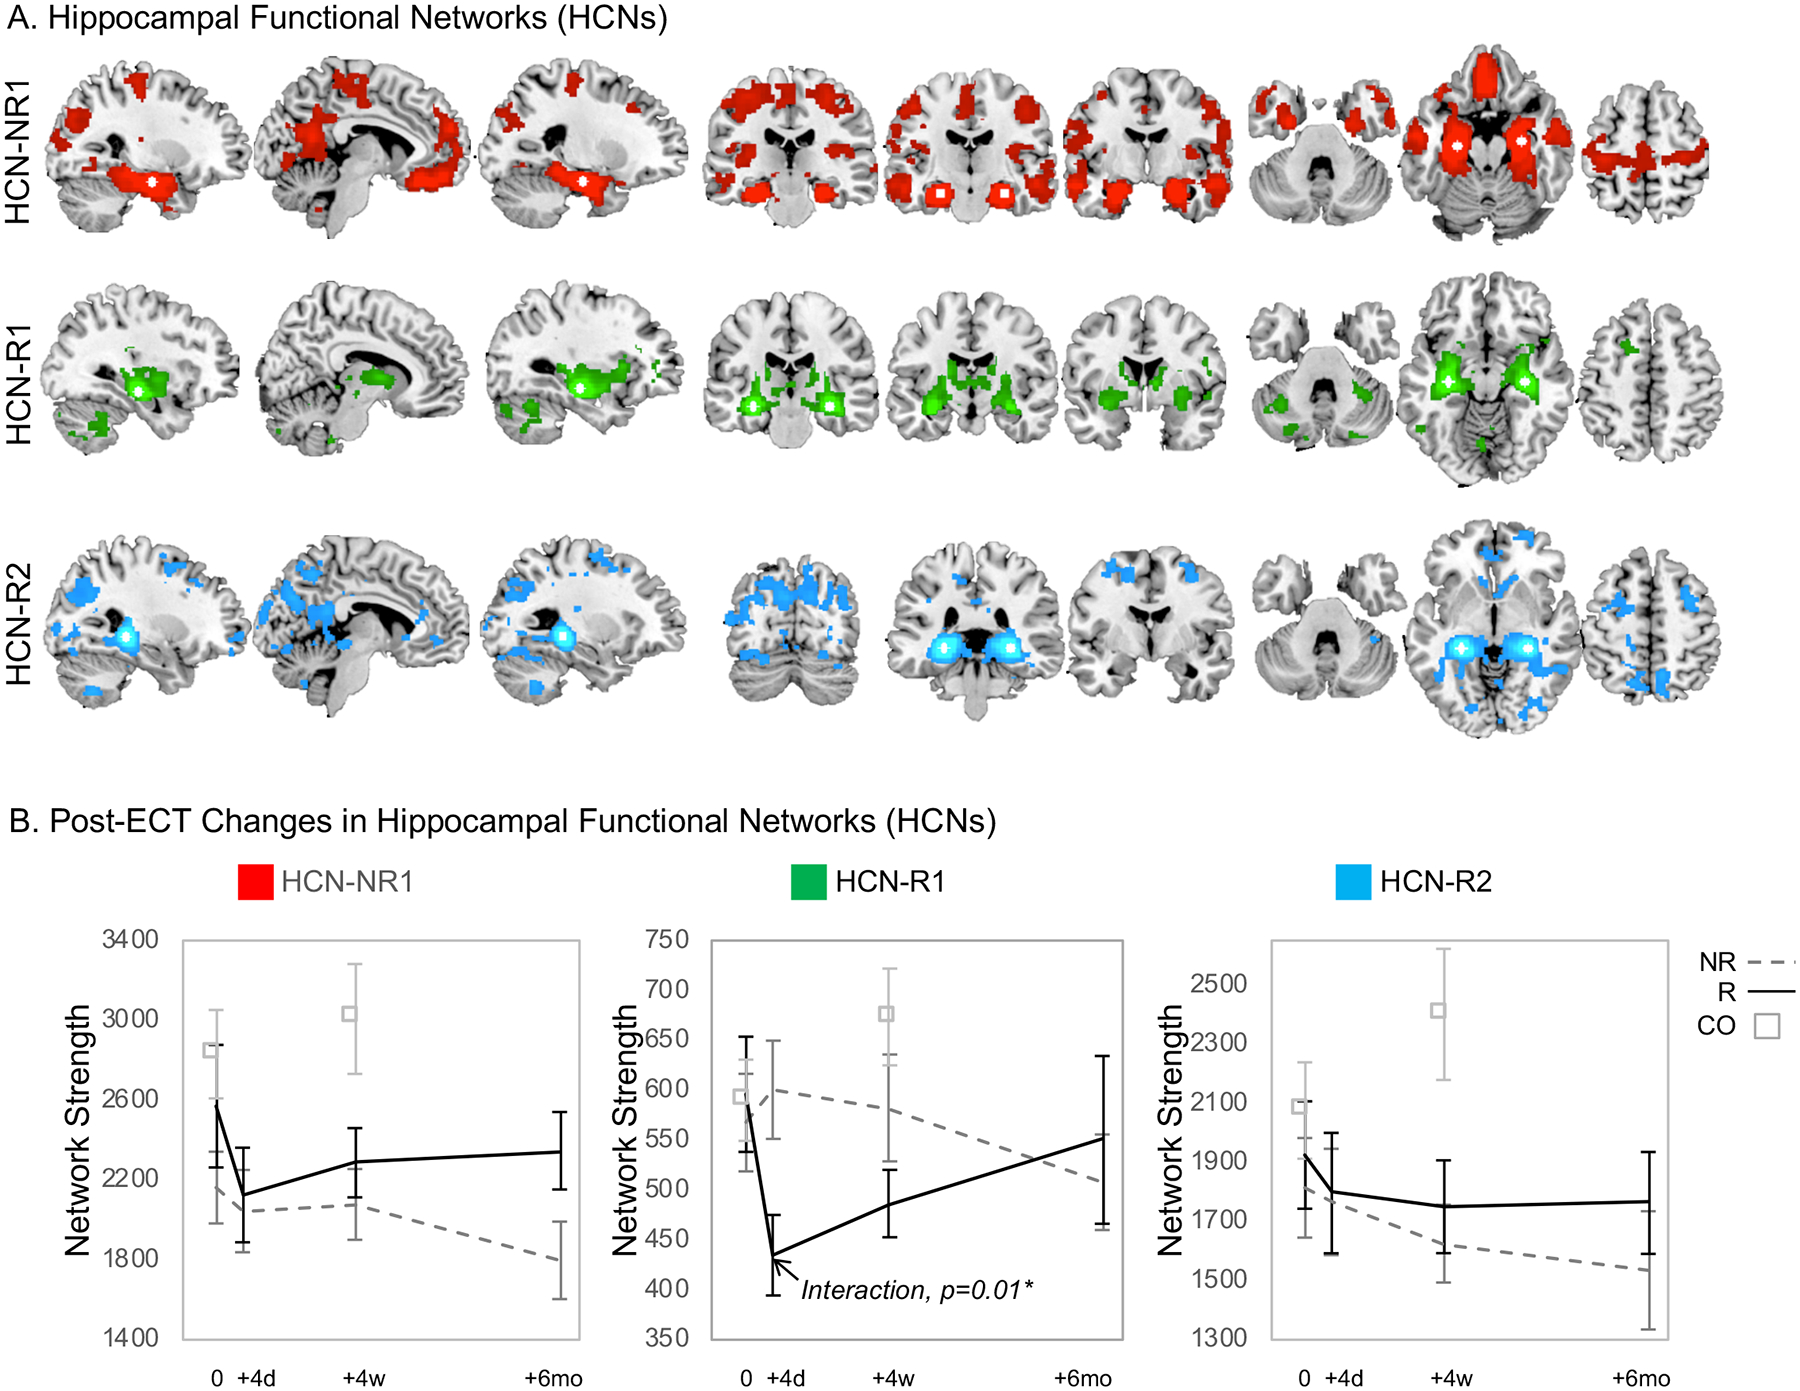
Figure 4.

Seed-based functional connectivity analyses of BOLD-fMRI data from non-depressed control volunteers established spatially separable functional networks associated with each hippocampal region exhibiting regional CBF change validated with LOO subsampling (Figure 3). A. The hippocampal functional network (HCN) associated with regions of CBF change identified in nonresponders (NR) is shown in red (HCN-NR1), the network associated with increased CBF in right mid hippocampus in responders (R) is shown in green (HCN-R1), and in left posterior hippocampus in blue (HCN-R2). The location of the pair of seed regions used to define each network is displayed in white. B. Graph theory analyses assessed changes in network strength and hippocampal centrality over treatment course. Plots of network strength over time are displayed, with data from responders plotted in a solid black line, and data from nonresponders plotted in a dashed gray line. Corresponding hippocampal centrality data can be found in Supplementary Figure 1.
