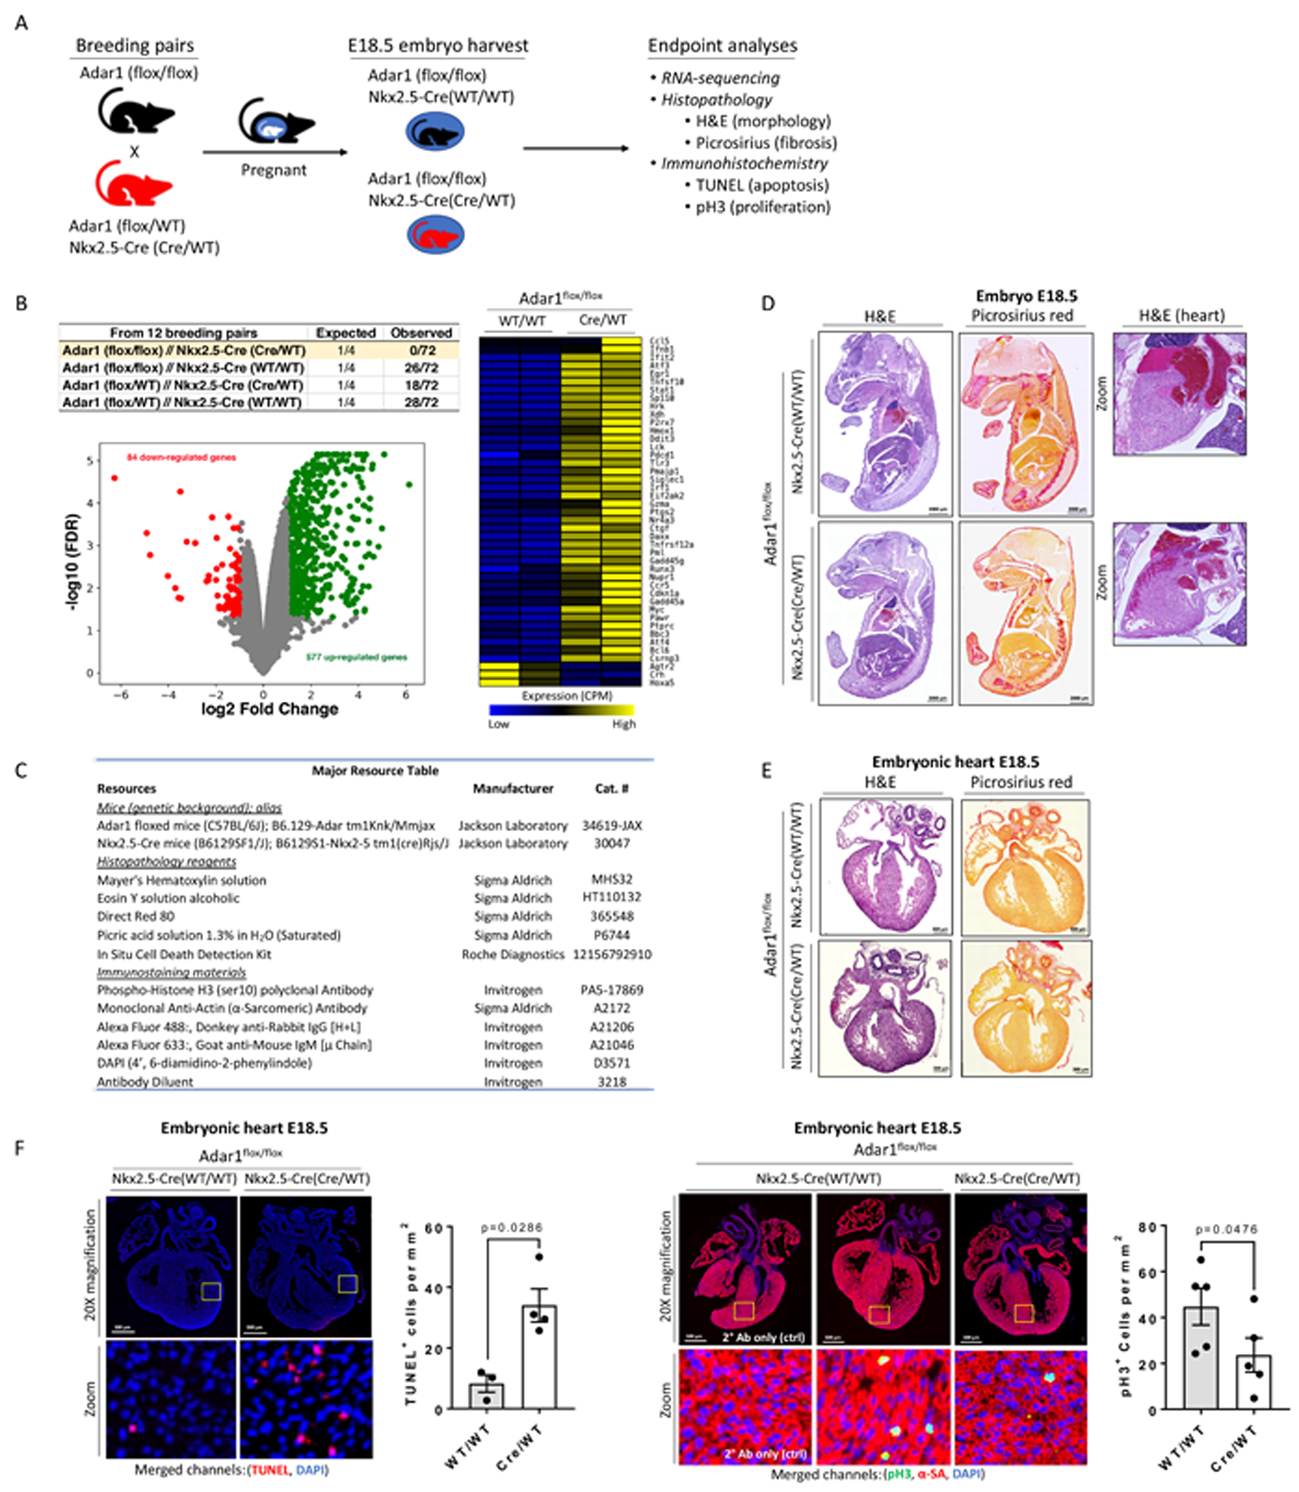
Figure 1: Adar1 in embryonic cardiac growth and development.

(A) Genetic crosses used in this study. (B) Table details genotypes of 3-week-old pups. Volcano plot depicts RNA-sequencing results of E18.5 hearts (GSE141345) from Adar1-ablated and wild-type littermate controls (N=2 embryos). Heatmap illustrates differentially-regulated genes under the GO category of cell death. (C) Resource table. (D) E18.5 embryos. Scale=2000 μm. N=3 embryos. (E) E18.5 embryonic hearts (N=2~3 embryos). Scale=300 μm. (F) Immunostaining for TUNEL+ or phospho-histone H3+ cells. Scale=500 μm. Graphs depict the total number of TUNEL+ (WT/WT, N=3; Cre/WT, N=4; Mann-Whitney Test)- or pH3+ (WT/WT, N=5; Cre/WT, N=5; Mann-Whitney Test)-nucleated cells per mm2 with mean ± SEM. Animal experiments were approved by the Animal Care and Use Committee of University of Louisville. Histological analyses were carried out in a blinded manner. Both sexes were used in analyses.
