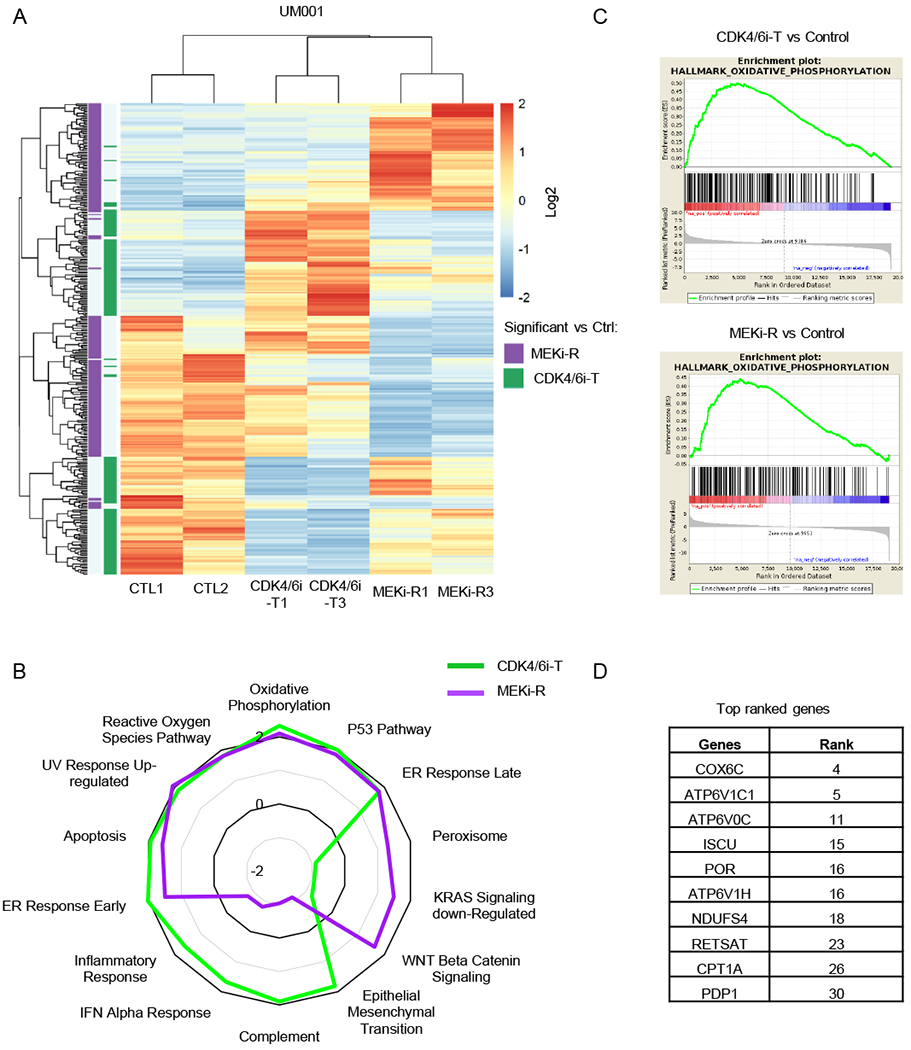
Figure 3. Enrichment of OxPhos signature in CDK4/6i-tolerant (CDK4/6i-T) and MEKi-resistant (MEKi-R) tumors.

A Heatmap of unsupervised hierarchical clustering of samples based on genes differentially expressed between CDK4/6i-T and control (CTL1, CTL2) (green) or MEKi-R and control (CTL1, CTL2) (purple) (BHFDR < 0.05 and absolute log2(FC) > 1). B Radar plot showing normalized enrichment score (NES) values for CDK4/6i-T or MEKi-R vs control samples for the most commonly enriched gene sets as well as most variable between CDK4/6i-T and MEKi-R. C Gene set enrichment plots of the top-ranked Hallmark OxPhos gene set for comparison of CDK4/6i-T (top) or MEKi-R (bottom) to control samples. D Top ranked genes within the OxPhos pathway in both CDK4/6i-T and MEKi-R samples.
