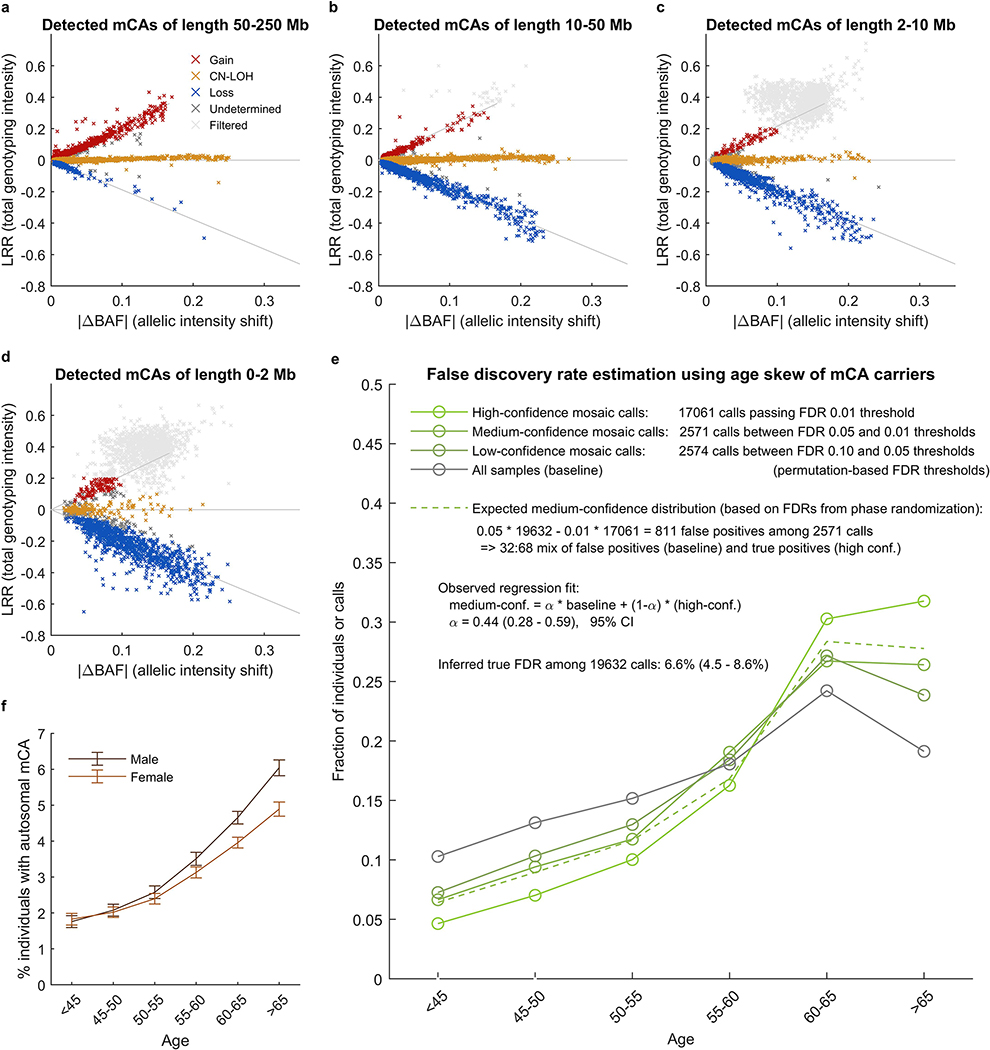
Extended Data Figure 2: Copy number determination and QC of mosaic chromosomal alteration calls.
(a–d) Total vs. relative allelic intensities of mCAs detected on each chromosome. Mean log2 R ratio (LRR) of each detected mCA is plotted against estimated change in B allele frequency at heterozygous sites (|ΔBAF|). The data exhibit the characteristic “arrowhead” pattern in which LRR/|ΔBAF| approximately equals a positive constant for gain events, zero for CN-LOH events, and a negative constant for loss events. Possible constitutional duplications were filtered according to thresholds on LRR and |ΔBAF| defined in Supplementary Note 1. Constitutional duplications have expected |ΔBAF|=1/6 and have LRR≈0.36 in this data set. We chose exclusion thresholds to conservatively discard all calls that might belong to this cluster, applying more stringent filtering to shorter events because (i) most constitutional duplications are short and (ii) shorter events have noisier LRR and |ΔBAF| estimates. (e) Estimation of false discovery rate using age distributions of individuals with mCA calls. We generated age distributions for (i) “high-confidence” detected events passing a permutation-based FDR threshold of 0.01 (bright green), (ii) “medium-confidence” events below the FDR threshold of 0.01 but passing an FDR threshold of 0.05 (darker green), and (iii) “low-confidence” events below the FDR threshold of 0.05 but passing an FDR threshold of 0.10 (darkest green; excluded from our call set but plotted for context). We compared these distributions to the overall age distribution of UK Biobank participants (grey). Based on the numbers of events in each category, ≈32% of medium-confidence detected events are expected to be false positives. To estimate our true FDR, we regressed the medium-confidence age distribution on the high-confidence and overall age distributions, reasoning that the medium-confidence age distribution should be a mixture of correctly-called events (with age distribution similar to that of the high-confidence events) and spurious calls (with age distribution similar to the overall cohort). We observed a regression weight of 0.44 for the component corresponding to spurious calls, in good agreement with expectation, and implying a true FDR of 6.6% (4.5–8.6%, 95% CI based on regression fit on n=6 age bins). (f) Fractions of individuals with at least one detected autosomal mCA stratified by age and sex. Error bars, 95% CI. Numeric data are provided in Supplementary Table 3.

