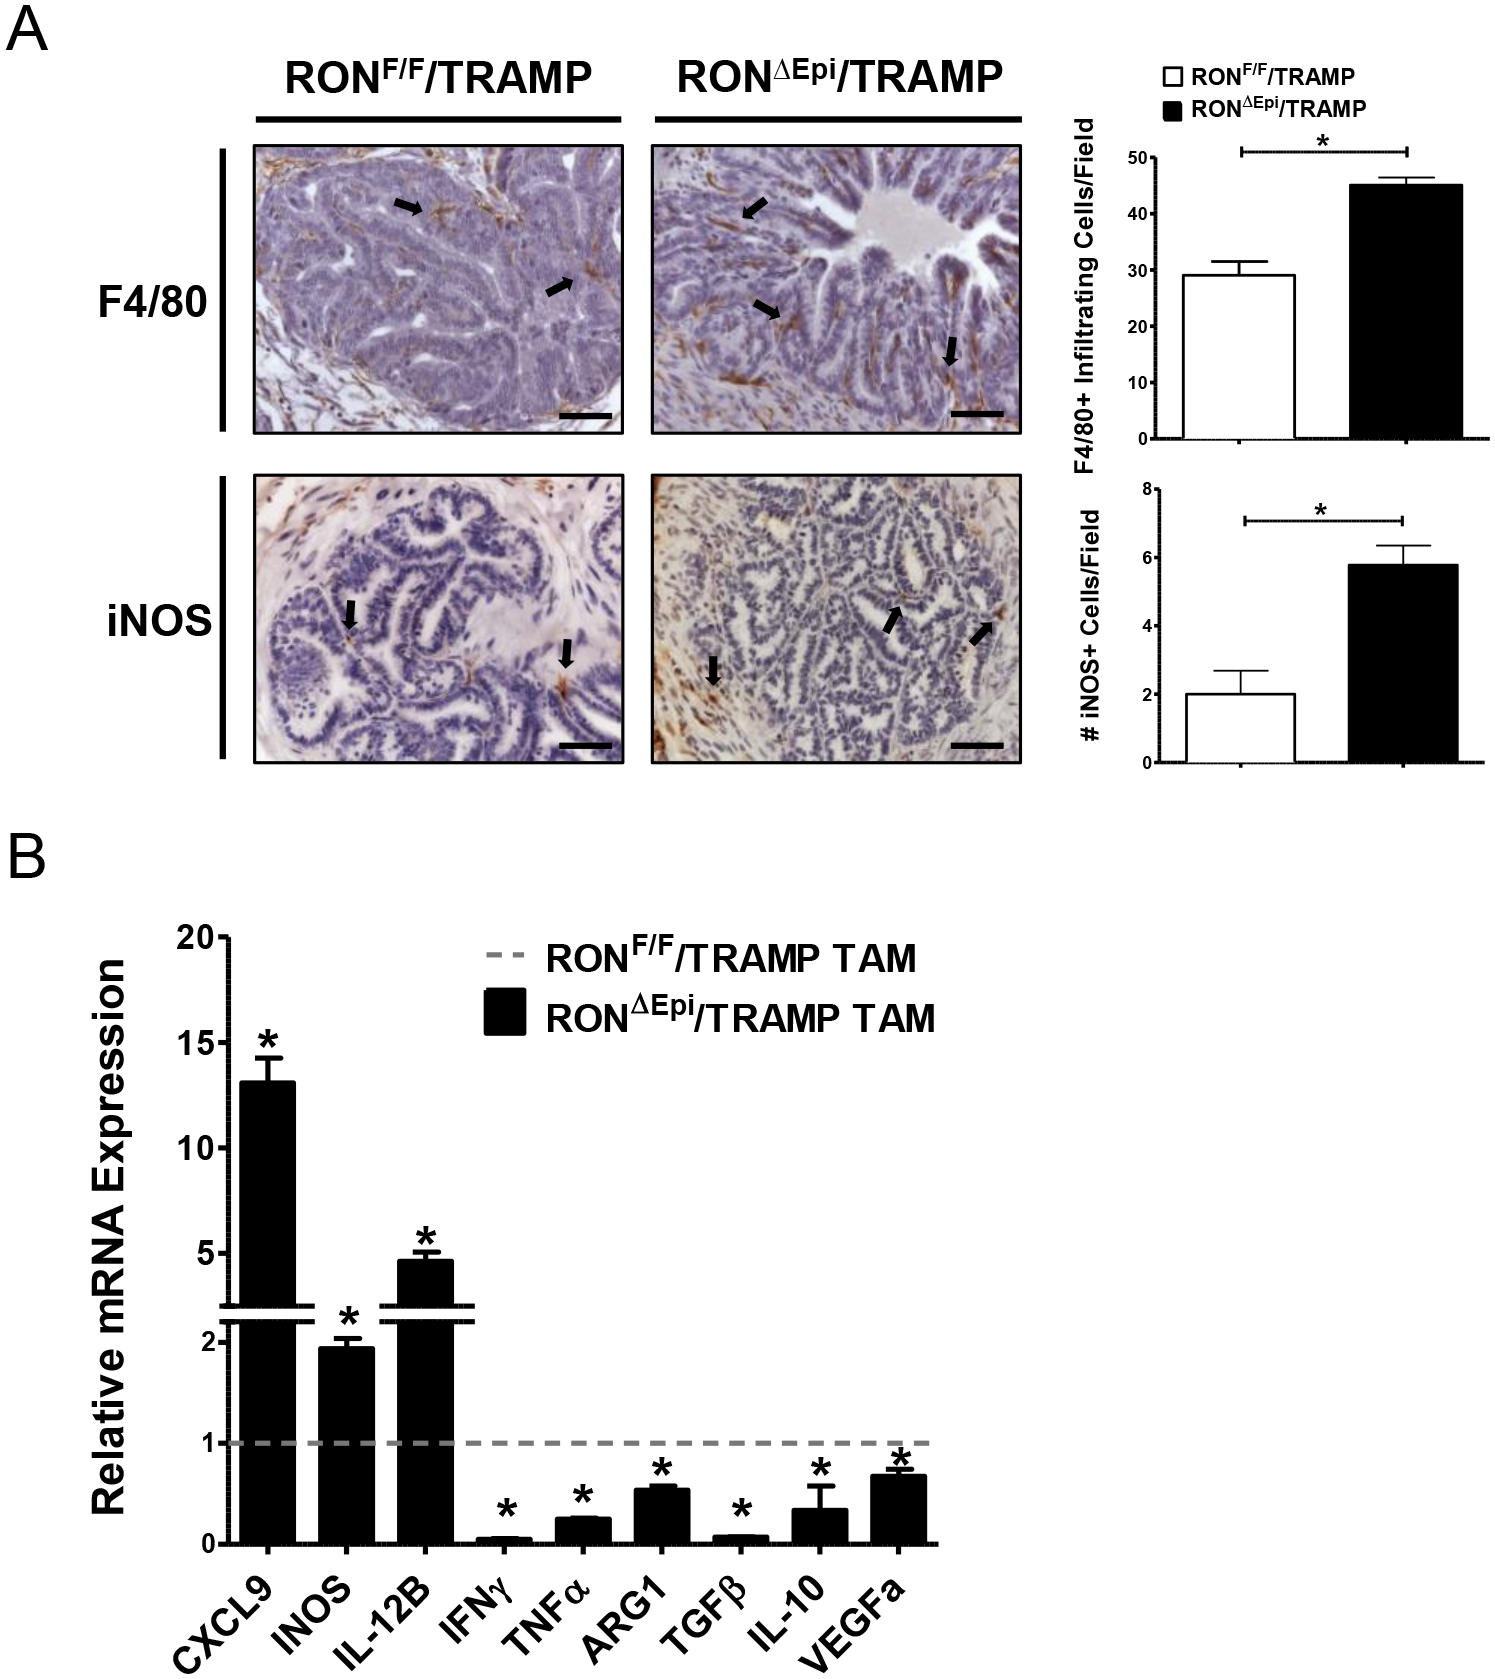
Figure 2. Epithelial RON loss leads to increased infiltration and M1 activation of macrophages in the tumor microenvironment.

A) Representative images and quantification of immunohistochemical staining of prostate tumors from RONF/F/TRAMP and RONΔEpi/TRAMP mice for F4/80 and iNOS (n=3 mice per genotype). Scale bars= 100 μm. B) qRT-PCR analyses for CXCL9, INOS, IL-12B, IFNγ, TNFα, ARG1, TGFβ, IL-10, and VEGFa mRNA expression in TAMs from RONF/F/TRAMP and RONΔEpi/TRAMP mice. Fold change in RONΔEpi/TRAMP TAMs over controls is shown. Dotted horizontal line represents the values of RONF/F/TRAMP TAMs, which were set to 1. Data represent mean values of 3 independent isolations of TAMs from pooled prostate tumors from each genotype. *P < 0.05.
