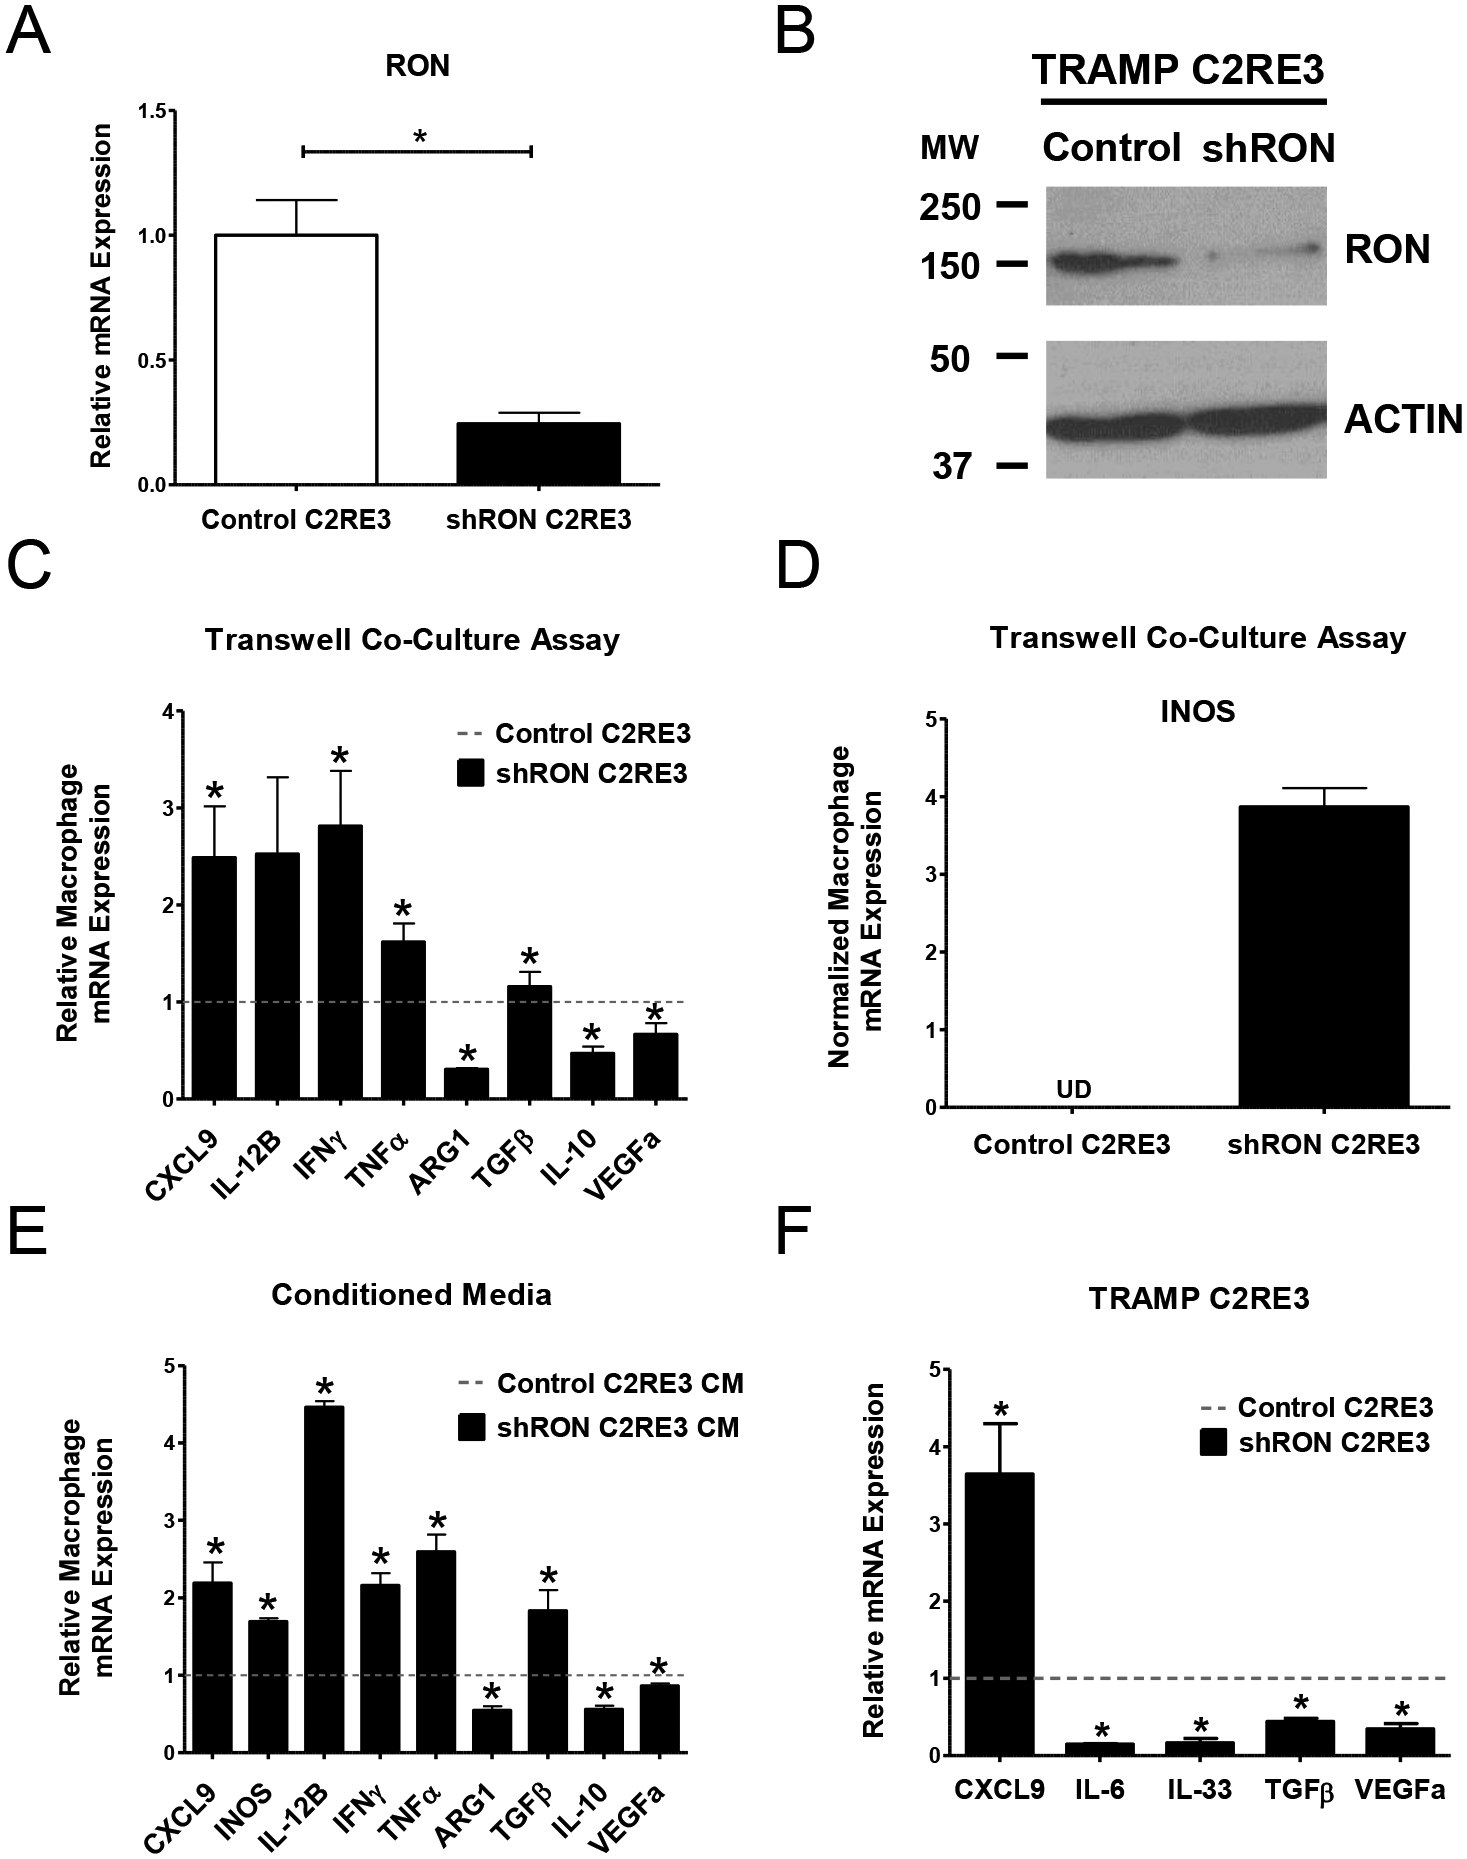
Figure 3. Epithelial RON loss induces M1 marker expression and suppresses M2 marker expression in macrophages through the production of tumor cell-derived soluble mediators.

A) qRT-PCR analyses for RON mRNA expression in Control TRAMP C2RE3 and shRON TRAMP C2RE3 cells. B) Western blot images showing the expression of RON in Control and shRON TRAMP C2RE3 cells. ACTIN is used as a loading control. MW, molecular weight (kDa). C-E) qRT-PCR analyses for CXCL9, INOS, IL-12B, IFNγ, TNFα, ARG1, TGFβ, IL-10, and VEGFa mRNA expression in BMDM either co-cultured with Control or shRON TRAMP C2RE3 cells (C-D) or cultured in conditioned media from Control or shRON TRAMP C2RE3 cells (E). The fold change in BMDMs co-cultured with or treated with conditioned media from shRON TRAMP C2RE3 cells over Control TRAMP C2RE3 cells is shown in C and in E. Dotted horizontal lines represent the values of macrophages co-cultured with or treated with conditioned media from Control TRAMP C2RE3 cells, which were set to 1. UD= undetectable. F) qRT-PCR analyses for CXCL9, IL-6, IL-33, TGFβ, and VEGFa mRNA expression in Control and shRON TRAMP C2RE3 cells. Fold change in shRON TRAMP C2RE3 cells over Control cells is shown. Dotted horizontal line represents the values of Control TRAMP C2RE3 cells, which were set to 1. *P < 0.05.
