
Figure 4. Prostate epithelial RON expression promotes RON expression in macrophages.
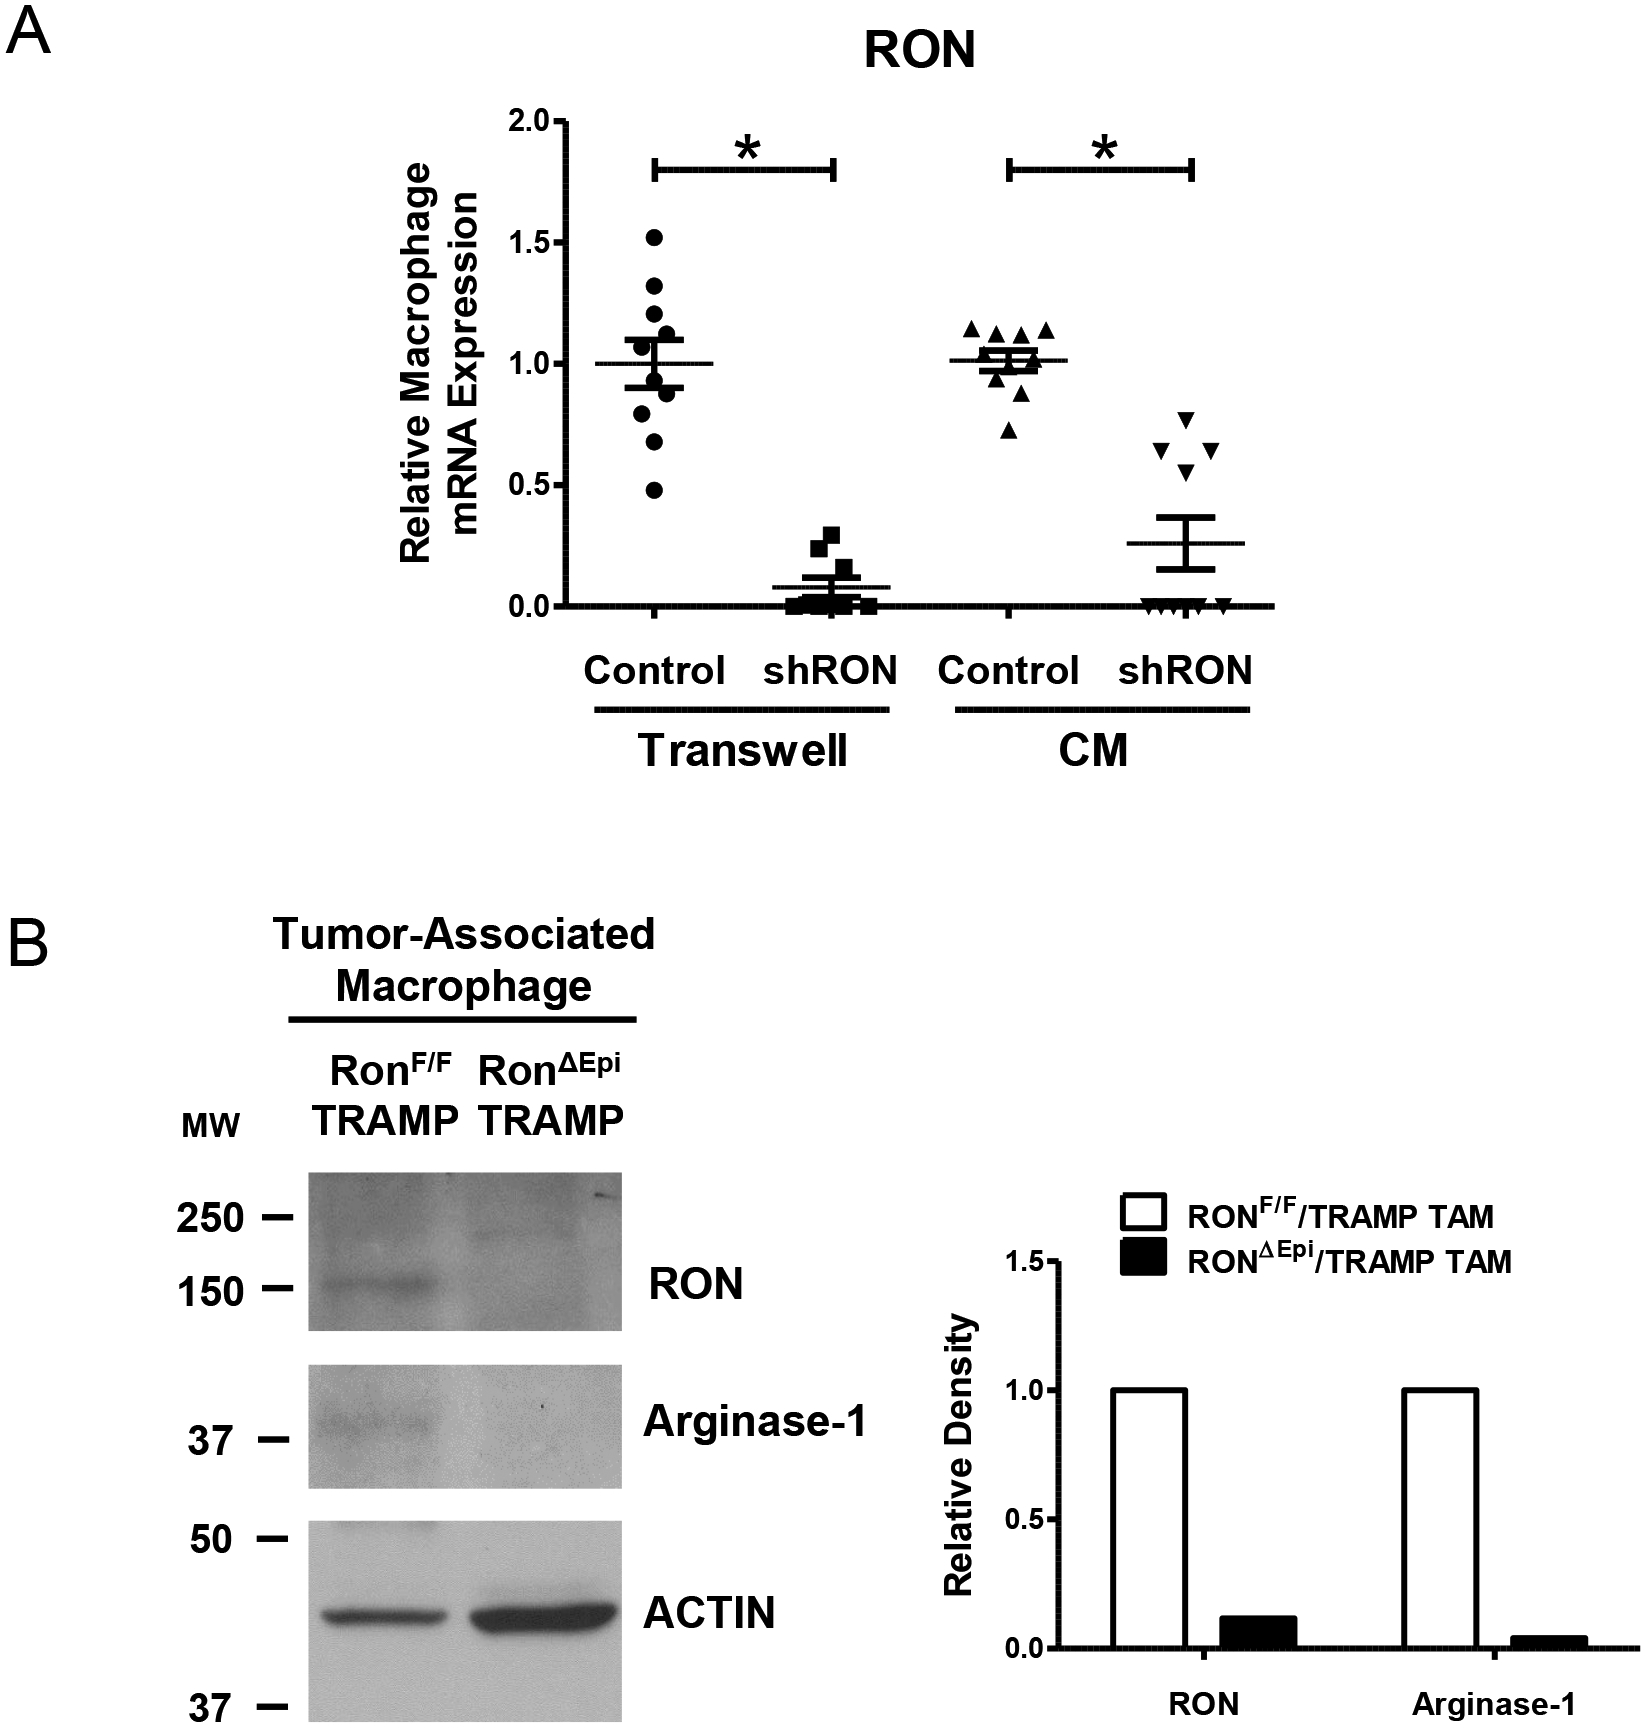
A) qRT-PCR analyses for RON mRNA expression in BMDM either co-cultured with Control or shRON TRAMP C2RE3 cells or cultured in conditioned media (CM) from Control or shRON TRAMP C2RE3 cells. *P < 0.05. B) Western blot images and densitometric quantitation of the expression of RON and Arginase-1 in lysates of TAMs isolated from pooled prostate tumors (n= 2–4 mice per genotype). ACTIN is used as a loading control. Quantitation of RON and Arginase-1 expression was normalized to ACTIN. MW, molecular weight (kDa).