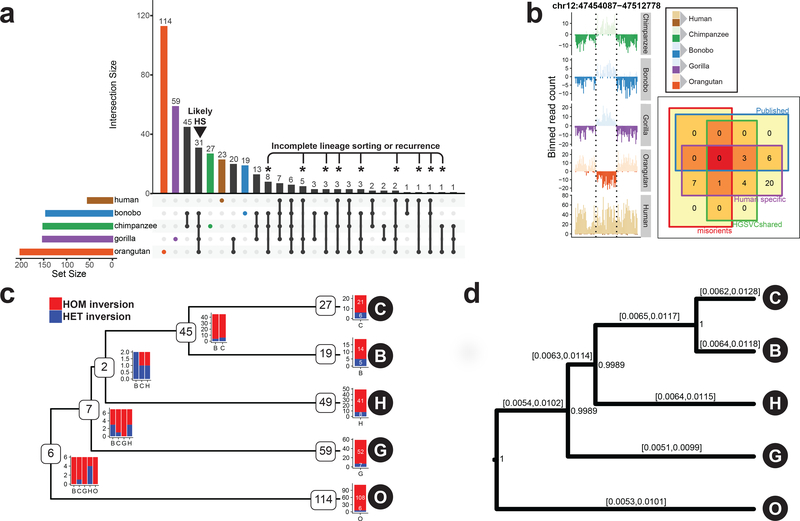
Figure 2 |. Lineage-specific simple inversions and their evolutionary rates.
a, An upsetR73 plot showing the number of shared inversions between members of the great ape family (≥50% reciprocal overlap). Black arrowhead points to putative human-specific inversions. Asterisks highlight inversions with recurrent or incomplete-lineage-sorting signatures. b, Example of a human-specific inversion predicted based on Strand-seq data. Inverted region is highlighted by dashed lines. Human-specific inversion is deemed as a region inverted in all NHPs in respect to the flanking region, but in direct orientation in humans. Inset: Venn diagram showing predicted human-specific inversions with respect to known genome minor alleles/misorients, human inversion polymorphisms4, and already published human-specific inverted loci. c, A tree constructed based on shared simple inversions (≥50% reciprocal overlap) using hierarchical clustering. Each branching node contains a number of shared inversions in a given subtree together with a barplot showing inversion genotypes per individual (B, bonobo; C, chimpanzee; G, gorilla; H, human; O, orangutan). Tips of the tree contain the number of inversions without a significant overlap (<50%) with any other inversion and are likely species specific. Barplot showing inversion genotypes for such species-specific inversions is plotted at each tip of the tree (Methods). d, A rooted MCMC evolutionary tree constructed based on a nonredundant set of 358 autosomal simple inversions among great apes. Inversion rates are reported for each branch as 95% highest posterior density confidence intervals. Numbers at each branching node provide posterior support for this tree topology based on 10,000 MCMC trees sampled from an MCMC chain of 10,000,000 samples constructed from these data.

