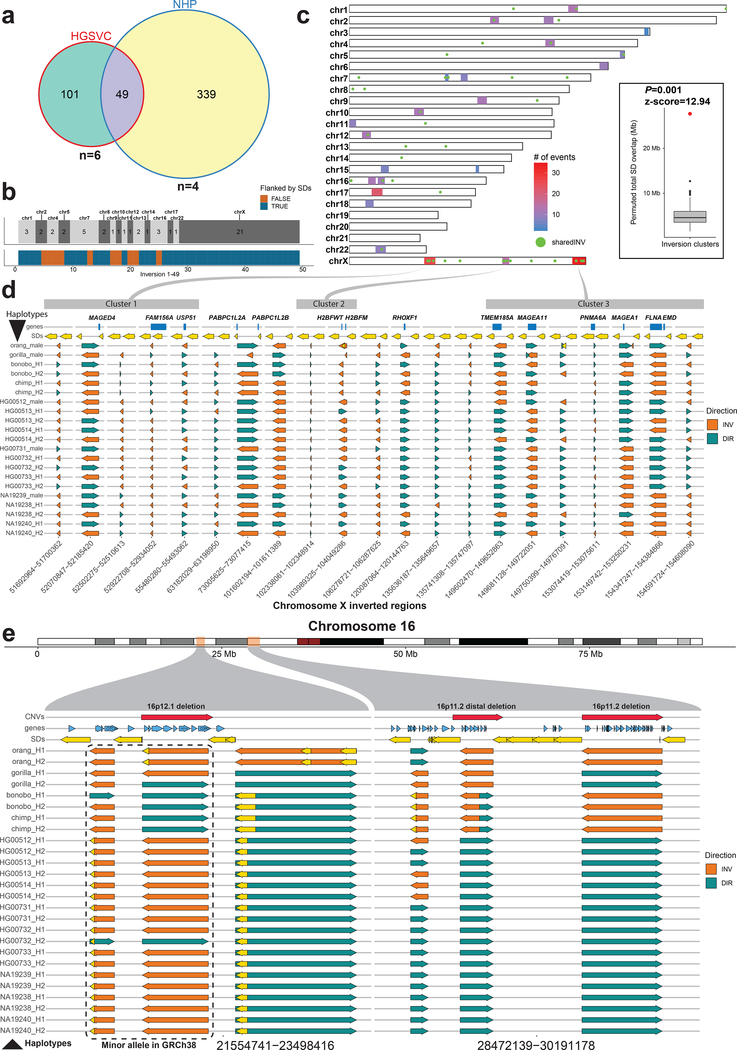
Figure 3 |. Shared inversions and inversion hotspots.
a, Venn diagram showing overlapping simple inversions (50% reciprocal overlap) between HGSVC nonredundant dataset and NHP redundant dataset. b, Top tracks: number of shared inversions between HGSVC and NHP datasets from a shown as counts per chromosome. Bottom track: inversions flanked by segmental duplications (SDs) are colored blue and those not flanked are orange. c, A genome-wide map of detected inversion breakpoint clusters based on simple inversions from HGSVC and NHPs. A set of inversions (n = 49) from a is plotted over this genome-wide map as green dots. Inset: compares the total number of SD base pairs mapping to the 23 breakpoint clusters (red dot, observed = 29,138,268) compared to a random genome-wide simulation (n = 1,000 permutations, RegioneR70 ‘permTEST’, min: 1,653,112, 1stQ: 3,757,630, median: 5,301,424, 3rdQ: 7,084,019, max: 11,940,452). d, Each row represents a haplotype with all tested inversions phased along the whole X chromosome. Inverted direction is shown by an orange arrow and direct orientation by a teal arrow. Top track plots protein-coding genes (blue rectangles) that overlap with either the inversion itself or with flanking SDs, shown as yellow arrows. Previously defined inversion breakpoint clusters are shown as gray rectangles at the top of the figure and are linked to their location on chromosome X in c. e, Each row represents a haplotype with all tested inversions phased along the whole chromosome 16. Inverted direction is shown by an orange arrow and direct orientation by a teal arrow. Top track plots protein-coding genes (blue arrows) that overlap either the inversion itself or with a flanking SD, shown as yellow arrows. Previously published35 pathogenic CNVs are shown as red arrows in the top track.

