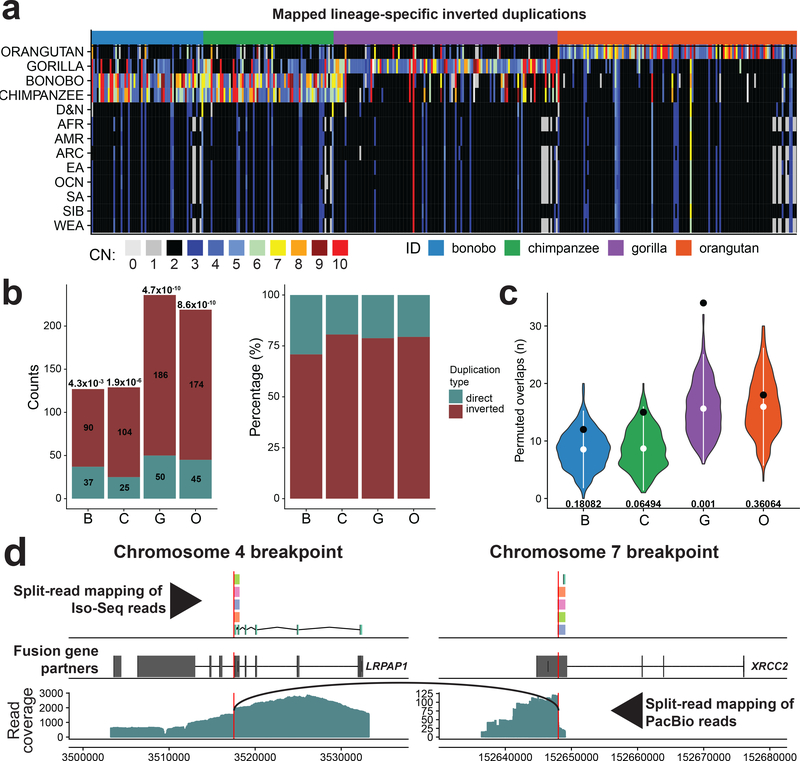
Figure 4 |. Evolutionary impact of inverted duplications.
a, Heatmap of estimated copy number (mean CN) per inverted duplication (columns) in multiple human populations and NHPs (rows). b, Left: number of mapped duplicated regions in inverted versus direct orientation. Significance of observed differences between inverted and direct duplications is reported above each bar as P-value (chi-squared with Bonferroni correction). Right: each bar shows the proportions of inverted and direct duplications per NHP (colored as denoted in a). c, Enrichment analysis of inverted duplication in 0.05 fraction of each chromosome end (1–22 and X). Observed counts are shown by a black dot and the distributions of permuted counts (n = 1,000 permutations, RegioneR70 ‘permTEST’,) are depicted by violin plots. White dots show the mean of each distribution (B-8.54, C-8.69, G-15.6, O-16). At the bottom of each distribution there is a P-value showing the significance of difference between observed (B-12, C-15 G-34 O-18) and permuted counts. d, Predicted gene fusion between XRCC2 on chromosome 7 and LRPAP1 on chromosome 4. Upper track: split-read mappings of Iso-Seq reads over the predicted breakpoint (red vertical line). Iso-Seq reads that belong to the same transcript share the same color. Middle track: gene models of above mentioned genes (Exons, wide boxes; Introns, lines in between). Bottom track: split-read mapping of PacBio reads over the fusion breakpoint on chromosome 4. Black arc line connects ends of PacBio reads with split-read mappings.

