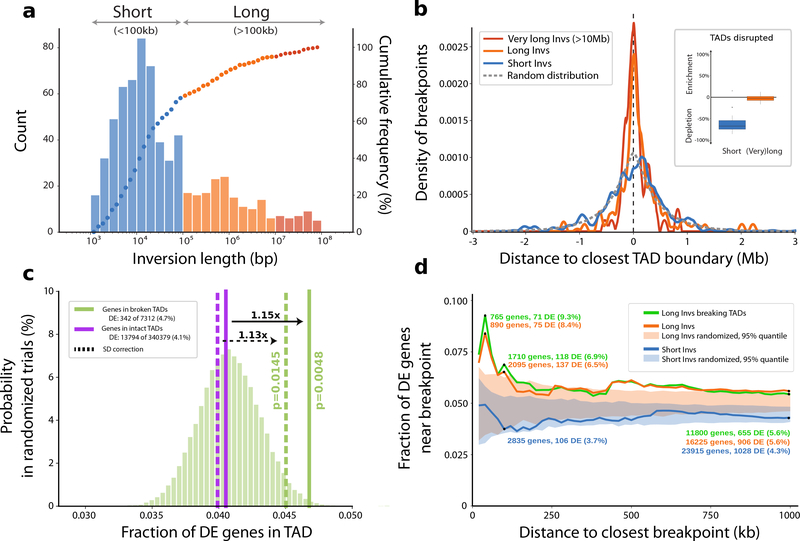
Figure 5 |. Impact of copy-neutral inversions on genome topology and differential gene expression.
a, Length distribution of all 387 nonredundant simple inversions, classified as ‘Short’ (<100 kb; blue) or ‘Long’ (>100 kb, orange). The histogram illustrates absolute counts of binned inversion lengths and the overlaid dots represent the cumulative frequency of inversions corresponding to each bin. (bp, base pair; kb, kilobase). b, Distance of each inversion breakpoint (centered at 0) to the closest topologically associating domain (TAD) boundary, stratified by inversion length (color coding according to a). The expected distance distribution for randomly placed breakpoints is indicated by the gray dotted line (Mb, Megabase). The inlay displays the proportion of inversions (stratified by length) that disrupt TADs (median short: −67.1%, median long: −2.4%). Percent ‘enrichment’ or ‘depletion’ is shown as the ratio of observed over expected disruptions calculated after randomizing inversion locations (Methods). c, Proportion of differentially expressed (DE) genes in TADs classified as either ‘broken’ (solid green horizontal line) or ‘intact’ (solid purple horizontal line). The underlying histogram depicts the expected DE frequency after randomizing TAD labels. Dotted lines represent the DE proportion after excluding genes in segmental duplications (SDs). One-sided permutation testing was used to derive P-values (Methods). d, Proportion of DE genes relative to inversion breakpoints and stratified by inversion length or whether the inversion disrupts a TAD. The shaded areas show the expected DE proportion measured in matched randomized breakpoints.

