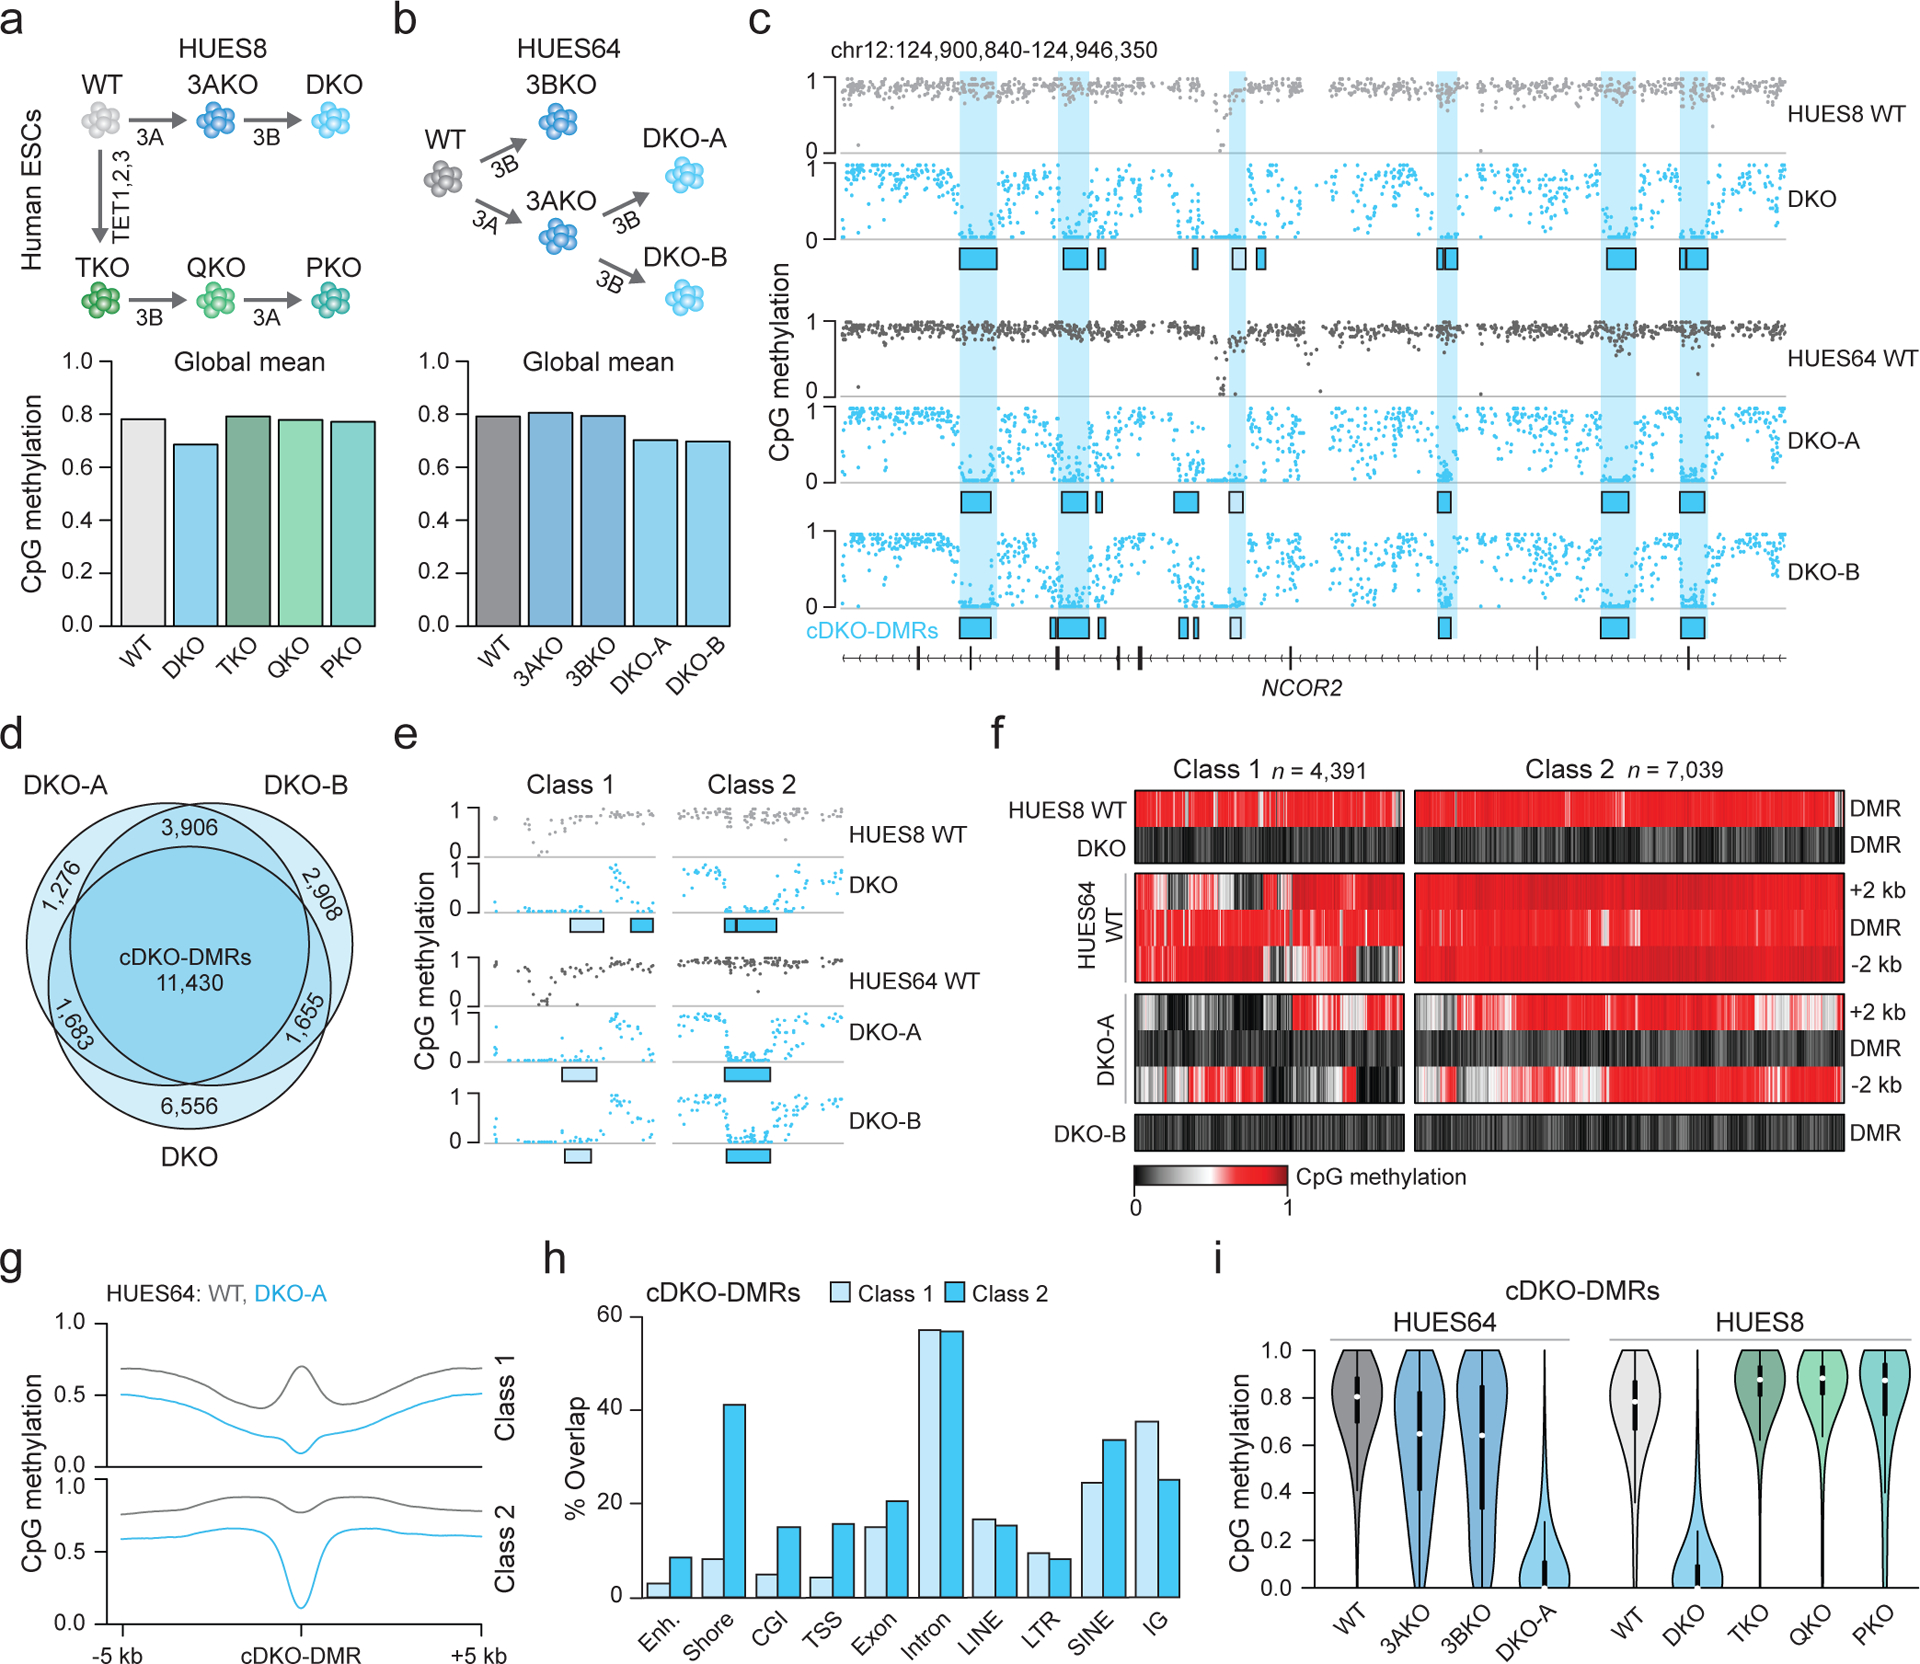
Figure 1: Focal demethylation by TET enzymes in the absence of DNMT3s.

a) Schematic overview. Knockouts are shown under each arrow. 3A = DNMT3A, 3B = DNMT3B. Barplot shows the global mean methylation for each sample using matched CpGs (n = 6,708,067) generated by WGBS. DKO and PKO ESCs were passaged six times.
b) Schematic as in a. Barplot shows the global mean methylation for each sample (CpGs match panel a). DKO-A and DKO-B denote clone A and B (passage 3), respectively. 3AKO and 3BKO are from published datasets18.
c) Genome browser tracks displaying WT and DKO methylation levels, sample-specific DKO-DMRs (boxes) and shared cDKO-DMRs (shaded vertical bars).
d) The overlap between DKO-DMRs hypomethylated in each sample.
e) Genome browser track of selected DKO-DMRs shown in panel c. Class 1 (light shading) border already hypomethylated regions and class 2 (dark shading) are flanked by highly methylated DNA.
f) Heatmap of cDKO-DMRs including 2 kb on either side, separated by class.
g) Methylation composite plot of class 1 and class 2 cDKO-DMRs with 5 kb on either side.
h) The percentage of cDKO-DMRs that overlap with the shown genomic features. Categories are not exclusive. CGI = CpG island, TSS = transcription start site and IG = intergenic. Enhancers are defined from H1 ESCs32.
i) Violin plots for CpGs located within cDKO-DMRs (n = 214,732, 180,019, 138,424, 215,263, 203,504, 182,322, 202,028, 212,215, 145,869 CpGs respectively). Violin plots extend from the data minima to the maxima with the white dot indicating median, thick bar showing the interquartile range and thin bar showing 1.5× interquartile range.
