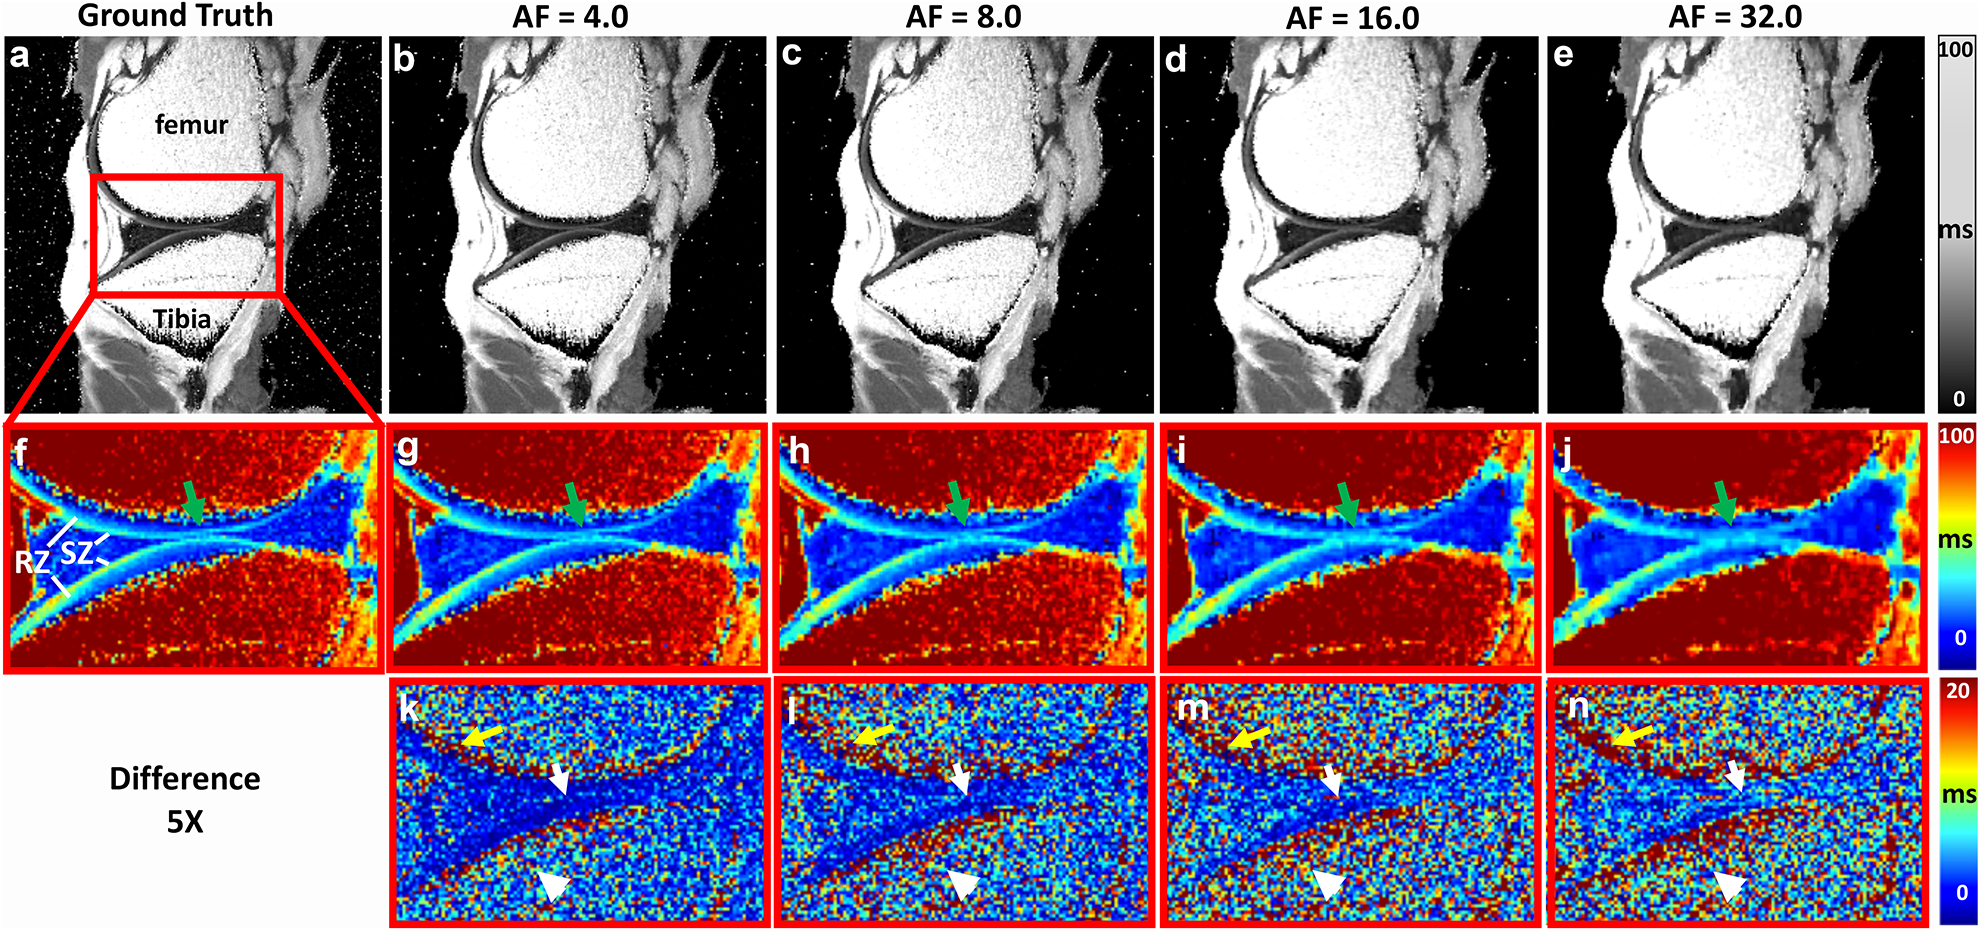
Figure 2.

Quantitative mMRI T2 maps at different AFs. T2 values showed strong depth-dependent properties throughout the cartilage region, where SZ had higher T2 values than RZ. The deviation from the GT gradually increased with higher AF, where the images became blurring in both cartilage (green arrows) and bone (white arrowheads) regions, especially for AF of 16 and 32. The while arrows in the 5x difference maps mark the interface between the femoral and tibial cartilage.
