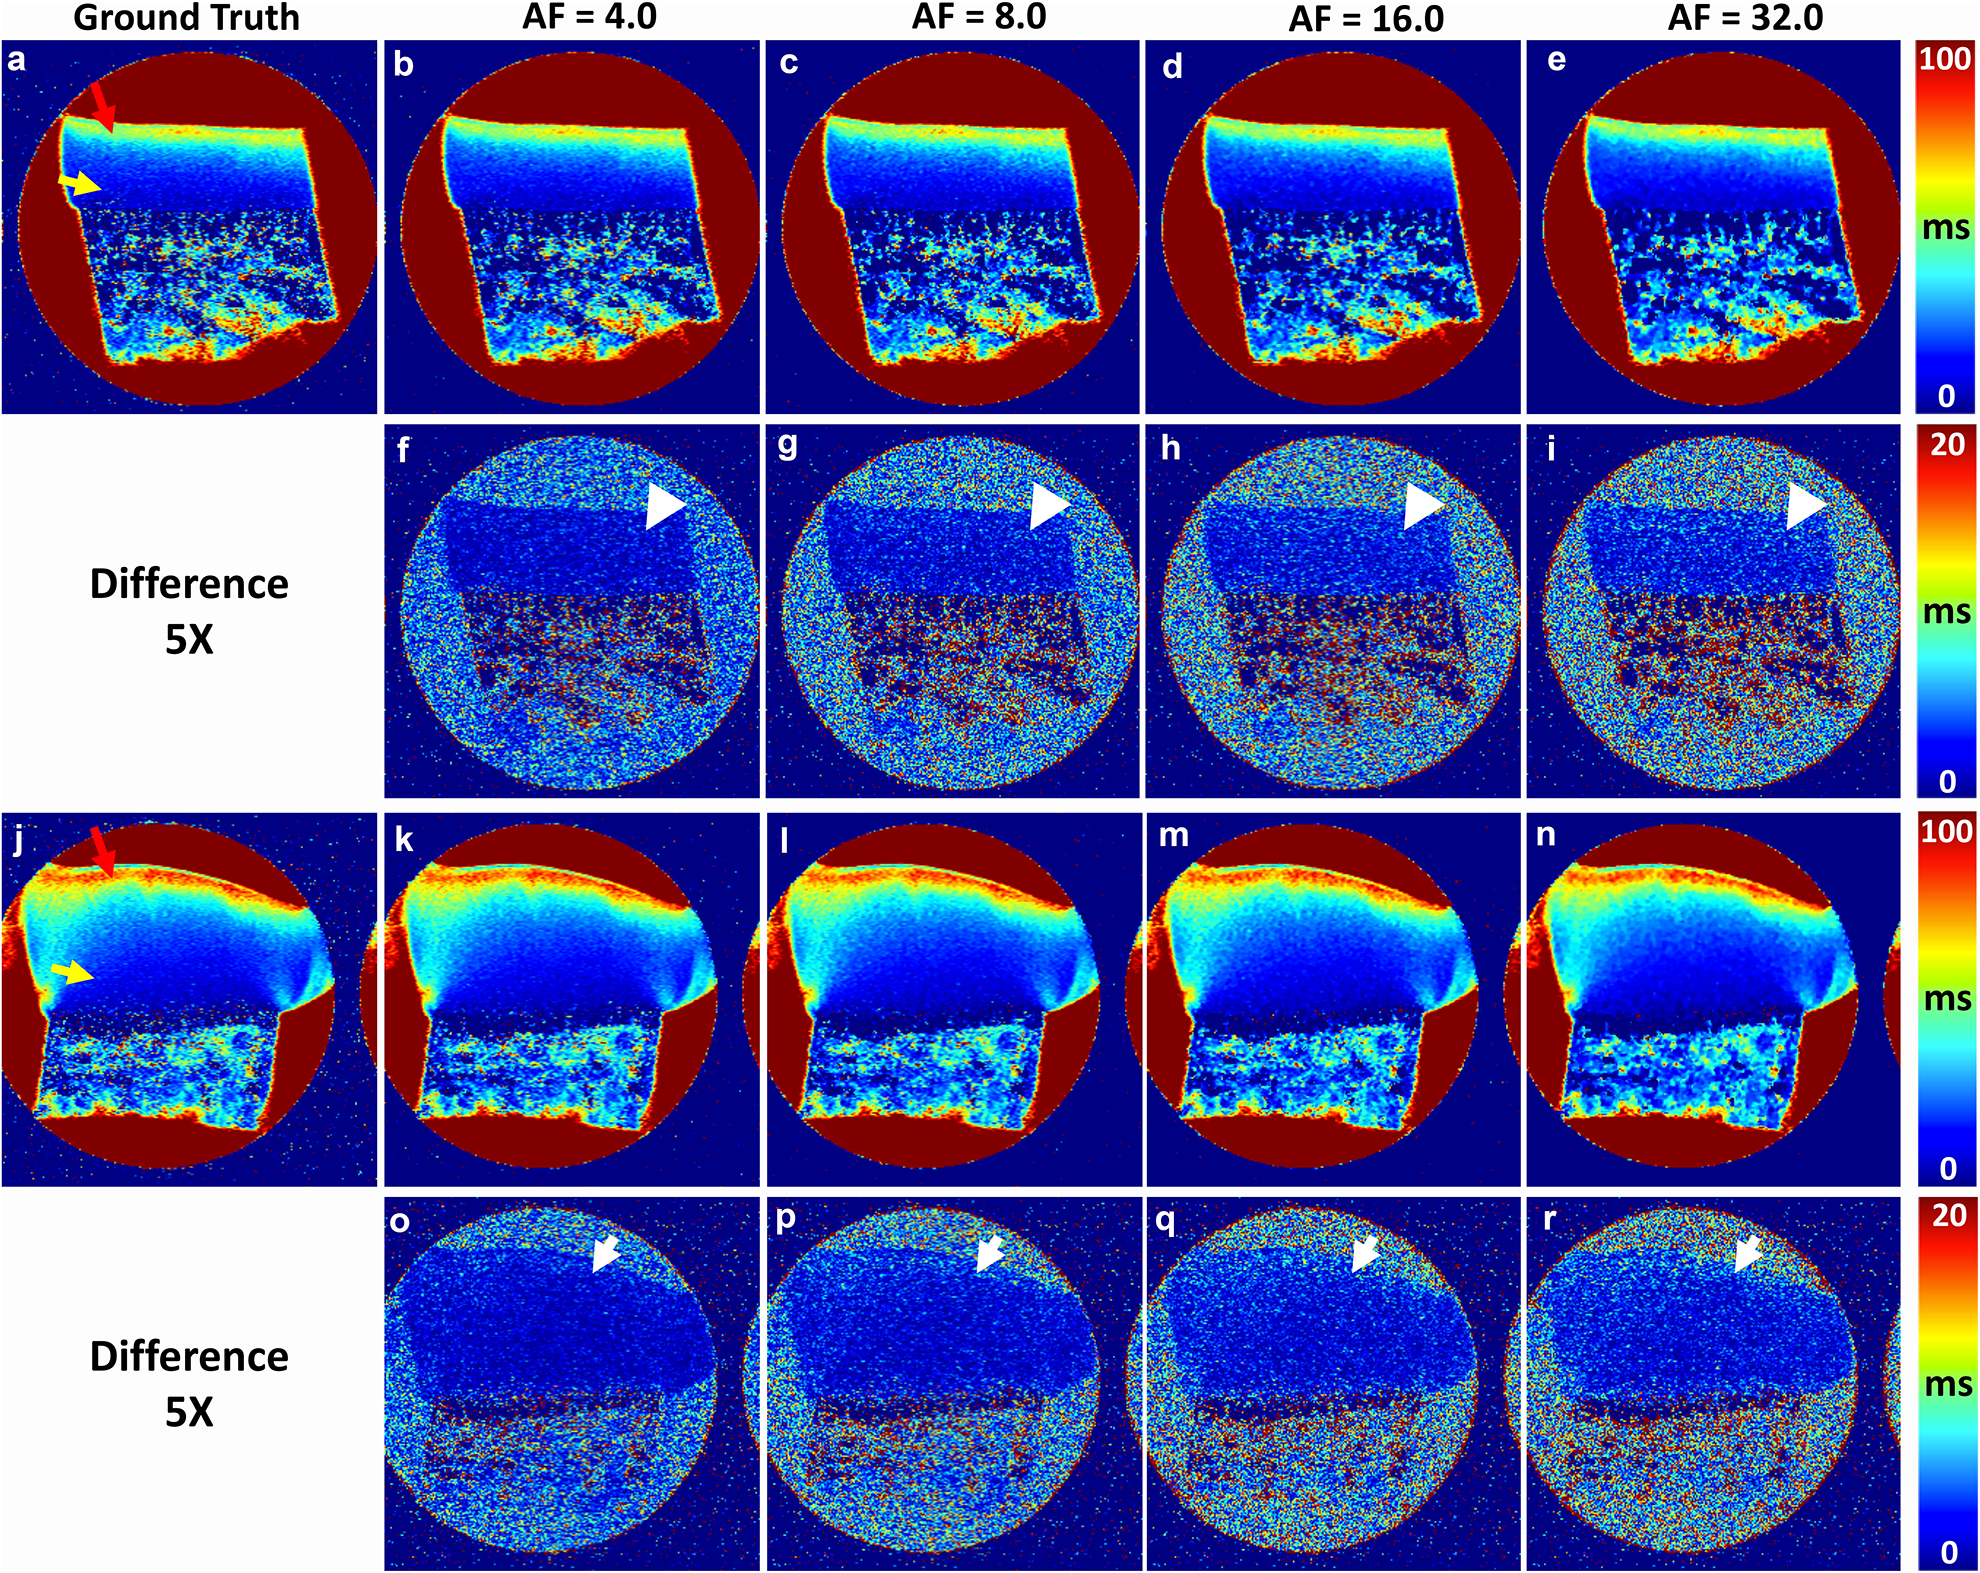
Figure 4.

Quantitative μMRI T2 at different AFs (4, 8, 16, and 32) and the corresponding error maps (5x) from the ground truth (a, j), where the images a-e are healthy cartilage while the images j-n are diseased cartilage. The color arrows in a and j mark the surface tissue and deep tissue. The white arrows and white arrowheads in the difference maps mark the regions with high deviations from the ground truth.
